
How Batch Pipelines Become Complex and Brittle Over Time
Every team that works with batch pipelines has experienced a well-known nightmare: getting notified about a job failure in the middle of the night. When something like this happens, dashboards suddenly become stale, stakeholders start asking questions, and the first thing teams usually try to do is restart the job, assuming it was a temporary problem.
And sure, at the beginning of our evaluations, errors do look operational. But it becomes obvious that this is not the real underlying issue. The real problem is the architecture, which easily becomes fragile once the data volume and enterprise requirements increase.
But I didn’t write this article to list the bad behaviors of batch pipelines. After all, they are, without a doubt, the backbone of power analytical systems, so the question isn’t why do we use them? It’s how do we structure them to support real-time decisions, compliance guarantees, and reliable data at scale?
In this article, we’ll explore why batch pipelines start simple but begin failing as data volumes and requirements grow. We will also see how a unified data movement layer with Estuary can help you rewrite this story.
Key Takeaways
- As systems scale, batch pipelines often become fragile due to hidden state, dependency chains, and delayed data visibility.
- Operational fixes and retries increase complexity over time instead of improving reliability.
- A unified data movement layer handles incremental change continuously, reducing backfills, downtime, and data inconsistency.
Why “Just Run the Batch Job” Is Not Working Anymore
As mentioned, most batch pipelines usually look simple in the beginning. Batch jobs are generally scheduled overnight; this way, teams can address any malfunctions before the start of the next day.
Jobs consist of three major steps for ETL or ELT pipelines: extract, transform, load. The approach seems fine for small-scale jobs and companies. Stakeholders are limited, data is not huge yet, and fixes are relatively easy.
Though this sounds pretty simple, it’s just an illusion supported by entity-relationship diagrams.
The reality is more complex:
- Even though most components look to be stateless, you still have stateful offsets.
- There are so many components that might break the order of data.
- Every source system is prone to changes in the schema. While this is typically a matter of communication with the source team, overlooking it can impact all downstream components.
When this happens, enterprises have high expectations. They want reliable and compliant data with clear ownership. It also needs to be so fresh that we can measure it in minutes.
Traditional batch architectures struggle to meet these demands.
How Do Batch Pipelines Become Complex and Fragile?
Problems in batch operations don’t usually appear out of nowhere. As setups get more complex, weaknesses start popping up slowly, making breakdowns more likely.
The Hidden Statefulness of Batch Pipelines
Even though we see batch jobs as stateless, there are plenty of states they are dependent on. A job may rely on successful completion of a previous run. In addition, source systems don’t promise anything regarding completeness, so we may get partial data with some job runs. We could also hit some rate limits on the source side, and each component might include internal watermarks.
Once these issues arise, teams typically try to find immediate workarounds to meet SLAs. But every workaround adds yet another state.
Here’s a very common pattern:
# You may see the pseudo-code reflecting the logic
# behind an hourly Airflow task

last_cursor = read_from_metadata_store("api_cursor")

response = requests.get(
    API_ENDPOINT,
    params={"cursor": last_cursor, "limit": 1000}
)

write_to_s3(response.json())

new_cursor = response.json()["next_cursor"]
write_to_metadata_store("api_cursor", new_cursor)
Even though it looks like a stateless operation, every Airflow task is prone to retry once an issue occurs. The schemas might change in the source, or a temporary network issue may lead to partial results.
Estuary treats the state as a significant part of the flow. It’s not dependent on the orchestration metadata anymore. We can easily detect API changes on top of changelog tables:
SELECT
    payload,
    cursor,
    captured_at
FROM api_capture_events
ORDER BY captured_at;
Dependency Chains and Cascading Failures
As your data grows, so do your requirements. That’s why most teams start looking for better ways to handle it, which, in turn, increases internal dependencies between tasks.
When it comes to orchestration, it’s easy to view a job as a series of interdependent tasks. They all rely on one other, thanks to the trigger mechanism. Basically, once a task completes, it triggers the next one, and the chain reaction continues.
Take, for example, a batch pipeline that gets data from an API, writes the results into an S3 bucket, loads data into Snowflake, and creates analytical tables to be used in Looker.
The first step is running this Python script in EC2, which gets data from a sample API and writes the results to the S3 bucket:
import json
import time
import requests
import boto3
from datetime import datetime

API_URL = "https://api.example.com/v1/events"
API_TOKEN = "API_TOKEN"
S3_BUCKET = "raw-api-ingestion"
S3_PREFIX = "events"

s3 = boto3.client("s3")

def fetch_events(page):
    response = requests.get(
        API_URL,
        headers={"Authorization": f"Bearer {API_TOKEN}"},
        params={"page": page, "limit": 100}
    )
    response.raise_for_status()
    return response.json()

def write_to_s3(data, page):
    timestamp = datetime.utcnow()
    key = f"{S3_PREFIX}/dt={timestamp}/events_page_{page}.json"

    s3.put_object(
        Bucket=S3_BUCKET,
        Key=key,
        Body=json.dumps(data),
        ContentType="application/json"
    )

def ingest_data():
    page = 1
    while True:
        payload = fetch_events(page)

        if not payload["data"]:
            break

        write_to_s3(payload["data"], page)

        page += 1
        time.sleep(0.5)

if __name__ == "__main__":
    ingest_data()
Next, we need to create an external stage in Snowflake, which mirrors the data that we have in the S3 bucket.
We also need to set up an hourly Snowflake task that copies the data from the stage into a raw table:
COPY INTO snowflake_raw.api_events
FROM @api_stage
FILE_FORMAT = (TYPE = JSON);
In the end, we need to run SQL queries to aggregate the raw data. This is going to create tables that will be used in the analytical layer in Looker:
CREATE OR REPLACE TRANSIENT TABLE events_clean AS (
SELECT
    event_date,
    event_type,
    COUNT(*) AS total_events
FROM snowflake_analytics.events
GROUP BY event_date, event_type
);
In this example, the first constraint is the API rate limits that might vary based on the time of the day. Partial responses might result in duplicates or missing data. The Snowflake COPY task can’t know whether the ingested data is complete or not, so Looker dashboards are updated with the wrong data without errors. As a result, dashboards may display missing events or duplicate entries.

When teams notice discrepancies, they need to pause Looker dashboards, re-run each step, and even backfill the entire data.
If these issues occur at any step, dashboards display the aggregated data late. Coordinating warehouse or database access across teams might be necessary, and entire database may even need to be restarted if there are no quick solutions. The main stakeholders should also be informed, regardless of whether they are internal or external users.
Estuary is capable of getting API data incrementally instead of getting partial API responses with batch pipelines. At the same time, you will keep the correct order and state. The whole process is quite straightforward. For example, let’s consider the HubSpot API, which is known for its complex structure.
On Estuary’s main page, click on Sources, search for HubSpot Incremental, and create a capture.
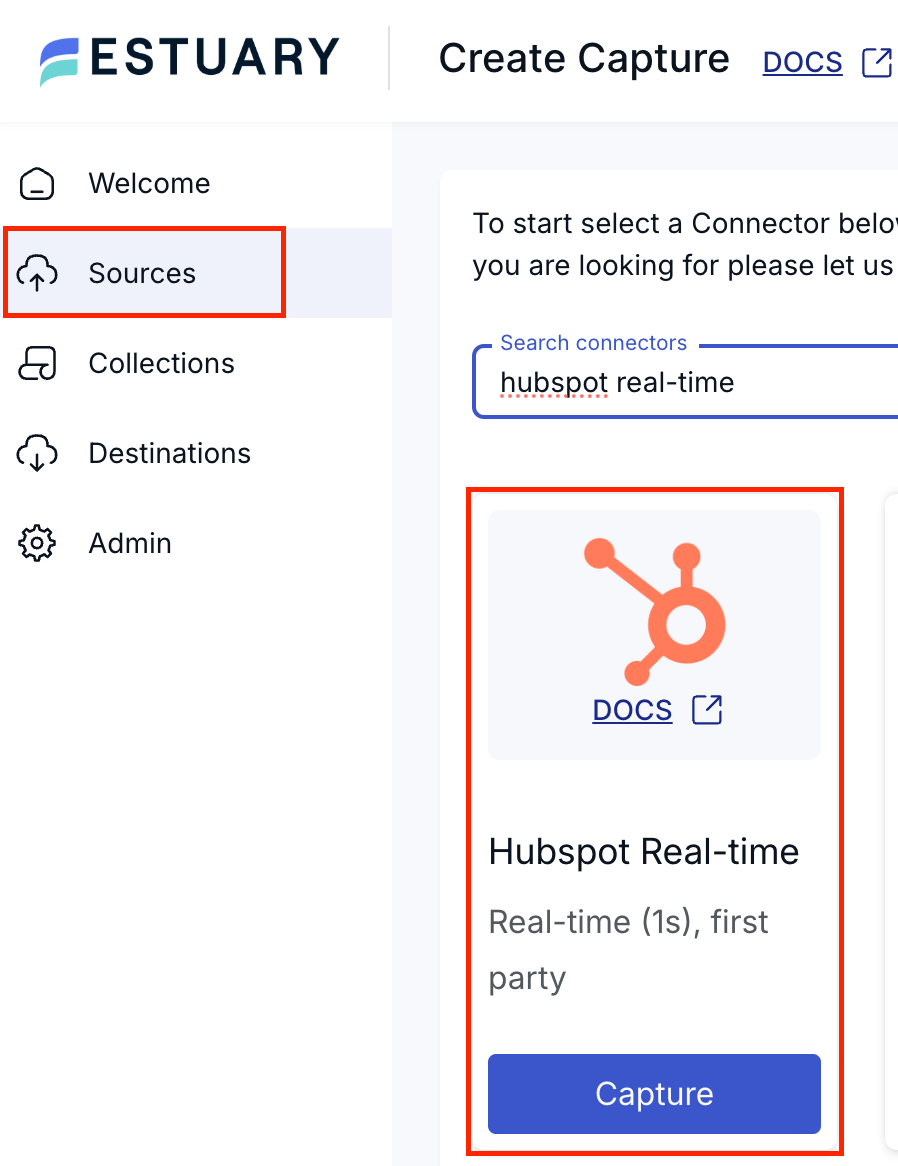
While defining it, you can mention all details about your HubSpot account, including your credentials. You can also specify which objects to sync, such as companies and deals. These will be the streams inside your HubSpot capture.

Even though the HubSpot API is rate-limited, Estuary will throttle it and resume.
After the HubSpot capture is created, the destination in this particular case will be Snowflake. In the Estuary UI, you can refer to the Destinations section and choose Snowflake as the materialization.
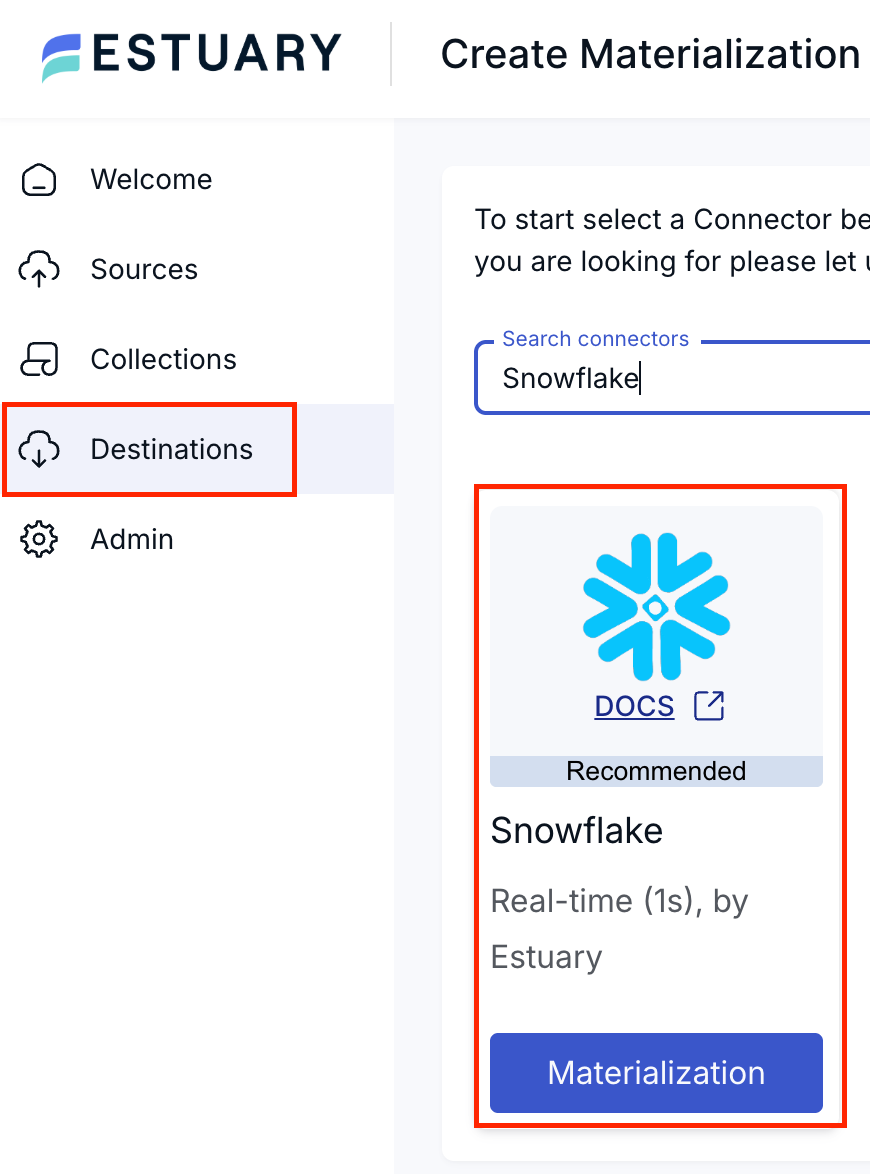
Once you’ve selected Snowflake as the destination, you should fill in the required fields with your Snowflake account information, including your credentials, the destination database, and the destination schema. You’ll also need to specify the role that is going to ingest the records and the warehouse that you will use during the ingestion.

Now you can create a binding between the newly created HubSpot capture and Snowflake materialization. You can edit your materialization and add a new binding. While defining it, you can choose the write mode, primary key, destination table, streams to ingest, schema evolution, and so on.
Once the whole sync is created, Estuary will perform an initial backfill and sync your source data to your destination with a right-time data approach.
As you can see, with Estuary, the data flow becomes much more solid:

Schema Changes and the Rising Cost of Batch Pipelines
Any structure is prone to changes in the source system, including schema changes or legacy columns. When this happens (and the communication with source team is lacking, which is often the case), the data we use might lose its meaning to stakeholders due to missing columns.
Batch pipelines struggle to adjust since they mostly rely on outdated data instead of steady methods. Once new changes are introduced to the pipeline, the result is often inaccurate data or failure in all components.
This isn’t about how teams implement the batch pipeline; it’s about the architecture in the background. Since it relies on initial conditions, any new changes can crash the working mechanism and cause failures.
Practical Example: From Airflow DAGs to Right-Time Data
When it comes to scheduling or orchestrating, the first tool that comes to your mind is probably Airflow. Think about an hourly Airflow ELT DAG:
- It gets the data from any kind of source database, such as MySQL or PostgreSQL.
- Then, it ingests the data into a warehouse for analytical purposes (think of BigQuery for this specific example).
- After the data arrives in BigQuery, it aggregates the raw data located in the staging layer that was ingested in the previous step.
- Finally, these analytical tables are used in visualization tools, like Looker.
However, what seems like a suitable setup today might change tomorrow, so keep an eye out. Hourly jobs may easily interfere with one another, backfills often start right away, and rebooting jobs demand more processing power. In addition, job links might need to be tweaked by hand, and you may have to verify new data again.
This is what the DAG will look like:
with DAG(
    dag_id="raw_orders_ingestion_and_transform",
    schedule_interval="@hourly",
    catchup=True,
) as dag:
    ingest_orders = MySqlOperator(
        task_id="ingest_orders",
        sql="""
        SELECT *
        FROM orders
        WHERE updated_at >= '{{ data_interval_start }}'
          AND updated_at < '{{ data_interval_end }}'
        """
    )
    transform_orders = BigQueryOperator(
        task_id="transform_orders",
        sql="""
        CREATE OR REPLACE TABLE analytics.orders_clean AS
        SELECT
            order_id,
            user_id,
            amount,
            status
        FROM raw_orders
        WHERE created_at >= TIMESTAMP_SUB(CURRENT_TIMESTAMP(), INTERVAL 1 DAY)
        """
    )
    compute_metrics = BigQueryOperator(
        task_id="compute_metrics",
        sql="""
        INSERT INTO analytics.hourly_revenue
        SELECT
            TIMESTAMP_TRUNC(created_at, HOUR) AS hour,
            SUM(amount) AS revenue
        FROM analytics.orders_clean
        GROUP BY 1
        """
    )

    ingest_orders >> transform_orders >> compute_metrics
In this example, the ingest_orders task assumes that the source orders table includes all changes made over the last hour. It ingests the data into raw_orders in BigQuery. Since the transform_orders task assumes the ingest_orders task has completed successfully, late-arriving records are now a part of the transformation layer, and they are already in the orders_clean table. Because metrics are also calculated based on the results of transform_orders, dashboards may end up displaying inaccurate information.
In the case of a backfill, historical data, which downstream jobs have already consumed, is rewritten. As a result, if a retry happens in one task, it invalidates the results in another task. The important point is that none of these trigger an alert. They quietly decrease data quality instead. This causes longer chains of dependency, and when the first step breaks, everything downstream collapses.

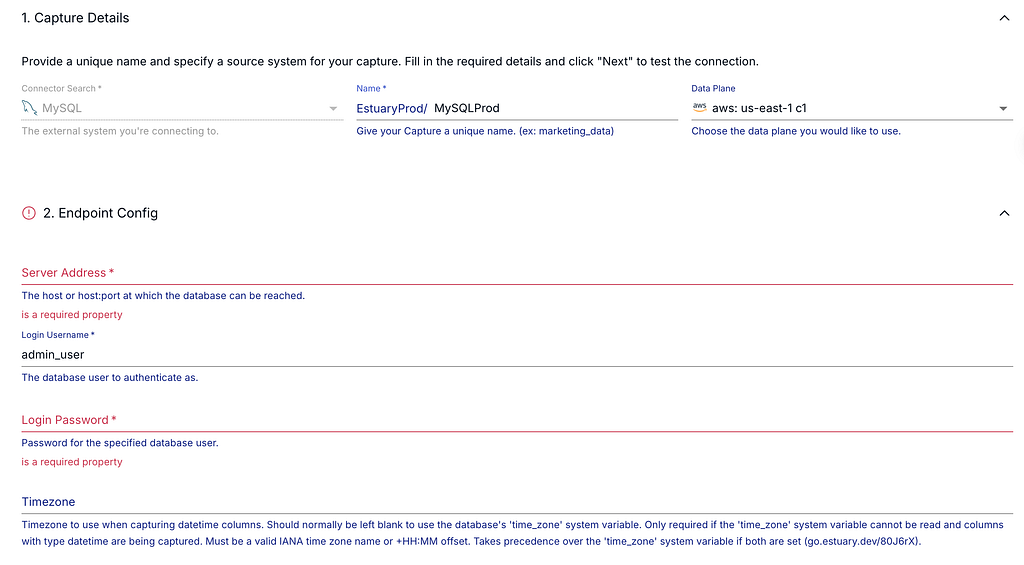
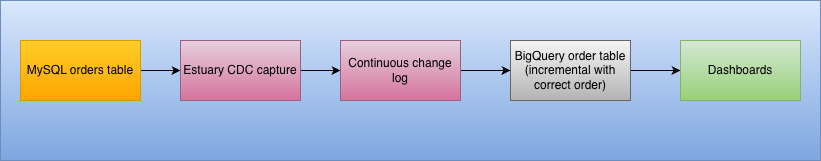
In Estuary, instead of long chains of dependencies, changes are detected only once and then, they start flowing continuously. For this specific example, the capture is going to be MySQL.
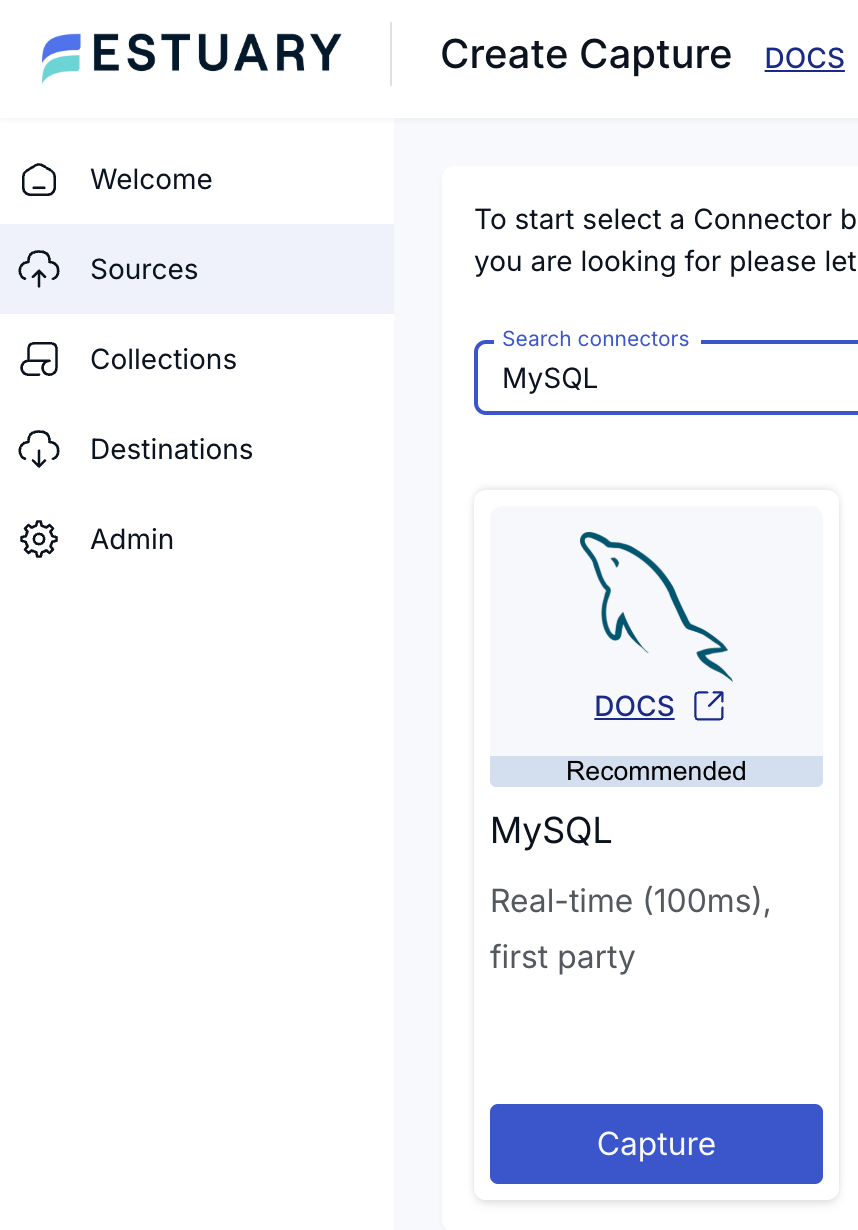
While setting up your MySQL source, you should define all your credentials first. Then, you can configure many additional advanced settings, such as tables that you would not like to backfill, specific databases you would like to connect, and the backfill chunk size.
Once your source MySQL is ready, you can move on to creating the destination materialization. In this example, we are going to use BigQuery as the destination, and you may choose your materialization as BigQuery.
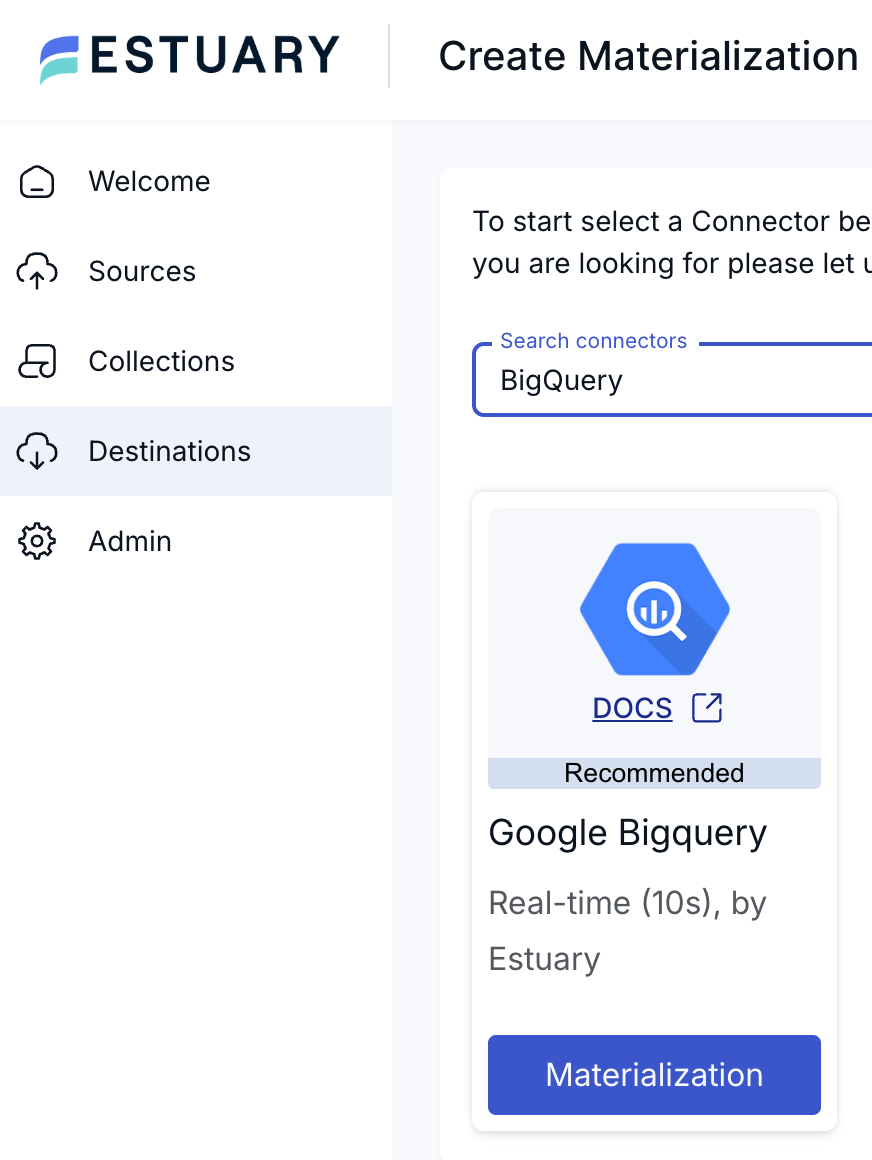
Then, you should define the credentials for your BigQuery account. There are many available parameters you can configure, including the region where your BigQuery account is located, the dataset where you would like to see your ingested tables, and the Google Cloud Storage bucket that will be used for temporary data and specifications.

With the additional advanced options, you can even specify more granular settings for your BigQuery materialization.
After creating both the source and the destination, you can establish a new binding between the MySQL source and the BigQuery destination. In the end, Estuary handles your data ingestion incrementally with the right-time data approach .
With this new implementation, you don’t need ingestion tasks in your Airflow DAGs. Since the data ingestion is going to be handled by Estuary, you can focus on locating your transformation tasks and keeping your Airflow DAGs more reliable.
This approach replaces the whole error-prone system with a steady flow of data.
With Estuary, you can sync your entire data set through log-based CDC, which will result in a steady pipeline. Even when something is updated in the source (schema change, column additions/deletions, etc.), Estuary is capable of detecting each change and automatically propagating them downstream.
The changes will have an immediate effect. Source and engineering teams can implement updates without relying on additional dependencies. Your data will remain fresh, up-to-date, and accurate, and you will not need full backfills or other operations that will create a costly load on your pipeline.
This is what real-time data actually looks like.
The Hidden Cost of Batch-Heavy Architectures
Batch pipelines are not designed to fail suddenly. Instead, they become insufficient as requirements grow.
Compute Costs That Scale Non-Linearly
If an issue happens in your batch pipeline and there is no quick workaround to resolve it, teams need to do backfills. This will come with a compute cost (warehouses in Snowflake, for example). Since data volume increases every day, each backfill will require extra compute cost over time.
Engineering Required for Recovery
One of primary goals of data engineering is to automate pipelines as much as possible. However, when an error occurs, human intervention is required.
The first thing we need to do is to detect the root cause and then re-run all the jobs if necessary. Afterward, we should perform sanity checks on downstream tables to ensure data quality. Finally, we need to communicate the issue and provide reliable updates to the stakeholders.
All of this requires significant time and effort from engineers.
Compliance and Audit Risk
Once a batch pipeline starts failing, it can lead to missing or partial data. Files or tables provided to stakeholders will lack important information, dashboards will start throwing errors, and daily/weekly reports may not work. Since failures are often partial, pipeline lineage can also become flawed.
All these issues create significant compliance and audit risks.
Trust Loss
We aim to build solid, reliable pipelines; however, just as importantly, we want to build trust with our users. In case of a critical failure, all downstream components will be broken. This will definitely impact the trust between engineers and end-users in a negative way, and more questions will arise regarding data accuracy.
Trust is built through consistency. Once an error happens or data loses its quality, this consistency is lost, and so is the confidence in the pipeline.
Why Is a Unified Real-Time and Batch Approach Better?
A unified approach treats data movement as a continuous flow rather than a series of scheduled jobs. The more frequently we check data freshness, the sooner stale data or any related issues can be detected. Instead of waiting for batches, real-time data flows enable smoother operations as a whole.
Modern AI or ML systems in particular are dependent on fresh and accurate data. By using incremental check principles, we can make sure our data is accurate and up-to-date. Since our models are trained on it, its stability is critical to prevent drifts. Real-time data is also essential if we want embeddings to remain current while agents are operating. At the same time, regulatory and audit requirements make clear lineage definitions essential.
Once pipelines are split into batch and streaming, data definitions become different, costs are duplicated, and complexity becomes hard to maintain.
A unified data movement layer solves all this.
Continuous Sync and Lower Warehouse Costs
Since Estuary syncs data incrementally, heavy computation costs are significantly reduced. Compute workers only process incremental changes rather than repeatedly scanning full tables, which results in more efficient warehouse usage.
One Platform, One Model
Estuary uses an approach that handles batch and real-time processing together. This means the same reliability promises, schema evolution guarantees, and governance model apply consistently across both systems. The architecture is simplified and operational maintenance is significantly reduced.
Flexible Deployment for Enterprise Requirements
Most pipelines are deployed into multiple cloud providers rather than relying on a single one. This is often done due to hybrid environment requirements or strict compliance rules.
Estuary’s BYOC and hybrid deployment models address these enterprise needs without demanding any additional architectural changes to your system.
Conclusion
Estuary is more than just another pipeline tool. It creates a solid structure that makes data move smoothly across multiple systems, and it gives you the ability to leverage its power for analytics, AI/ML, and compliance.
Once batch pipelines start to become fragile due to the increasing data volumes, the issue is rarely about how teams operate or whether everything was implemented correctly. The root cause is the architecture itself, which was probably not designed to meet modern-day expectations.
The best solution lies in the unified data movement. It creates a fully reliable system where you can reduce costs significantly, minimize the risk of downtimes and errors, and rebuild trust with your stakeholders.
With Estuary, this transition is smooth and reliable.