
Production-Grade AI-Powered Data Lineage Observability Agent with LangGraph, Airflow, DBT, Neo4j, MLflow, Gradio, GEval
Repository
https://github.com/dogukannulu/data-lineage
Overview
I built a system that automatically investigates Airflow pipeline failures end to end: from the moment a DAG task fails, through a graph walk of the DBT lineage tree, all the way to a written root-cause report stored in PostgreSQL and tracked in MLflow. The agent runs in under 30 seconds at the median, produces a structured hypothesis chain, and gets evaluated by a 50-incident golden test set graded by Claude itself acting as a judge. The entire stack -8 services-is managed by both Docker Compose for day-to-day development and Terraform for reproducible infrastructure-as-code deployments.
This article is the full technical story of how I built it, every design decision I made and regretted, and what the numbers actually looked like when I ran the evaluation harness.
Tech Stack
Full list of every dependency with its purpose in the project:
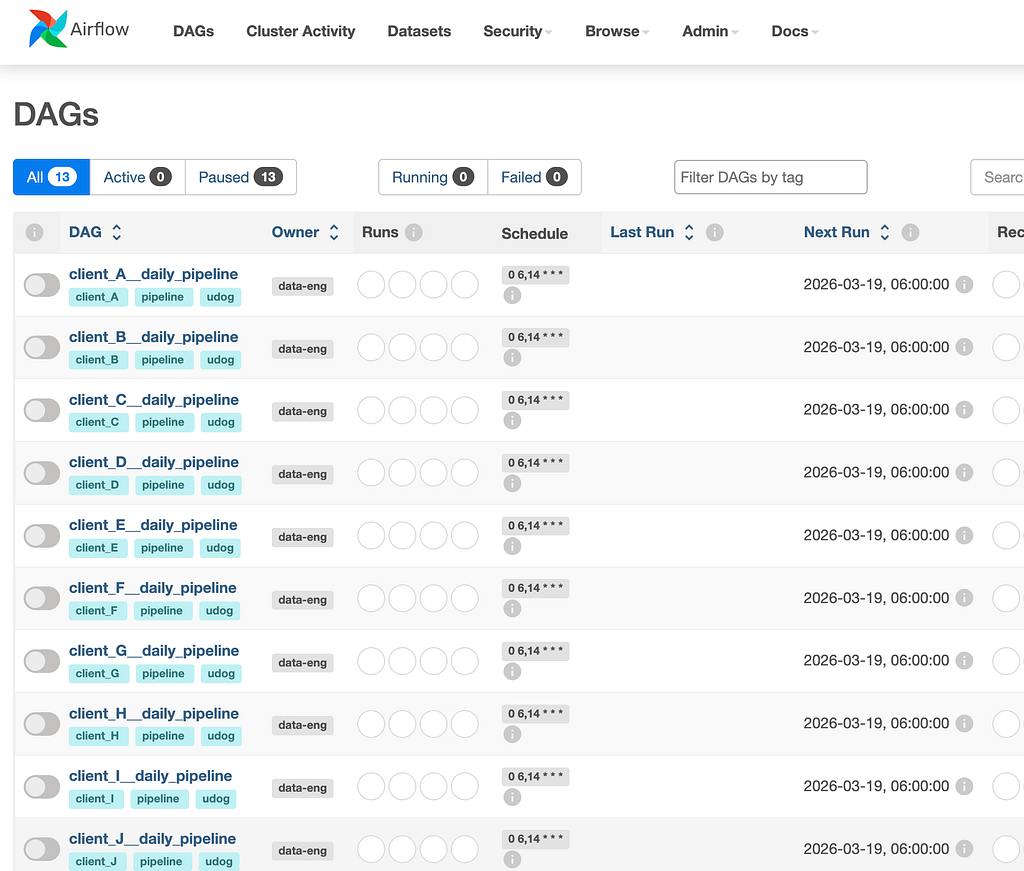
- Apache Airflow 2.9 — orchestration of 12 client DAGs, each running twice daily, with on_failure_callback wired to fire the investigation webhook
- LangGraph — 6-node state machine that sequences the investigation from triage through to report writing
- Anthropic Claude claude-sonnet-4–6 — hypothesis generation in HYPOTHESIZE and LLM-as-judge scoring in the GEval harness
- FastAPI — webhook receiver on /webhook/airflow and REST query endpoints for investigations and lineage
- uvicorn — ASGI server running the FastAPI app inside Docker
- Neo4j 5 Community — graph database holding the DBT lineage graph (84 nodes, 216 edges across 12 clients)
- PostgreSQL 16 — relational store for pipeline metadata (5 tables, 34,534 seeded rows)
- SQLModel — typed ORM models that double as Pydantic validation schemas
- Alembic — database migrations applied on container startup
- MLflow — investigation run tracking without the heavy ML dependency tree
- Pydantic — data validation across all API models and agent state
- Gradio — 4-tab browser dashboard for browsing incidents and triggering manual investigations
- structlog — structured JSON logging throughout the backend
- Docker— orchestrates the 8 services in a single-command local environment
- Terraform (kreuzwerker/docker provider) — declarative infrastructure management; 16 resources across containers, volumes, images, and network; the same stack can be reproduced with terraform apply and torn down with terraform destroy
- DBT — 5 model files (raw → staging → intermediate → mart) replicated across 12 clients = 60 compiled models
- GEval (LLM-as-judge pattern, implemented directly) — 3-metric evaluation harness over 50 golden incidents
Introduction
The setup I was working with: a hypothetical SaaS analytics company called UDog Analytics that runs identical data pipelines for 12 clients, which I’ll call client_A through client_L. Each client has the same DBT model chain — raw extraction, staging, intermediate transformation, and two mart models — all orchestrated by Apache Airflow running twice daily. When something breaks in that chain, an on-call data engineer has to triage the failure, trace it through the lineage graph, form a hypothesis about the root cause, verify it against run history, write up a fix, and log everything somewhere.
The challenge was that this triage process was manual, repetitive, and slow. The same five failure patterns — schema changes, null check violations, freshness staleness, timeouts, and upstream dependency cascades — accounted for the vast majority of incidents. Someone had to look at the same Airflow logs, walk the same DBT lineage graph, and write the same fix suggestion dozens of times per month across a dozen clients.
I wanted to see how far I could push automation on this. Not just alerting — actual investigation. The system I built accepts the Airflow failure webhook, runs a 6-node LangGraph state machine, queries Neo4j for lineage context, pulls 30 days of historical run data from PostgreSQL, calls Claude to generate ranked hypotheses, verifies them with SQL queries, and writes a complete incident report in under 30 seconds.
The evaluation question was equally interesting: how do you measure whether an AI agent is giving good answers, not just any answers? The answer I landed on was a GEval harness — 50 hand-seeded golden incidents with known root causes and known fixes, evaluated across three Claude-judged metrics.
Here is what I built, in full detail.
Architecture Overview
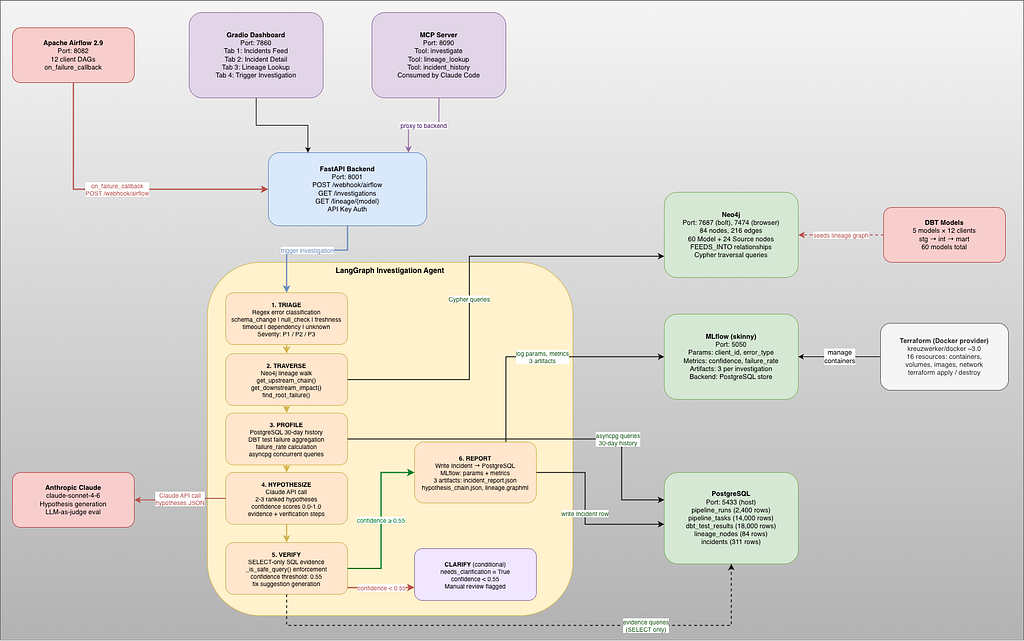
The system runs as 8 Docker Compose services on a shared bridge network called udog_net:
- PostgreSQL 16 (port 5433 external, 5432 internal) — the primary relational store. Holds pipeline run history, task-level results, DBT test results, the lineage node registry, and the incidents table. Both Airflow and the FastAPI backend connect to this instance.
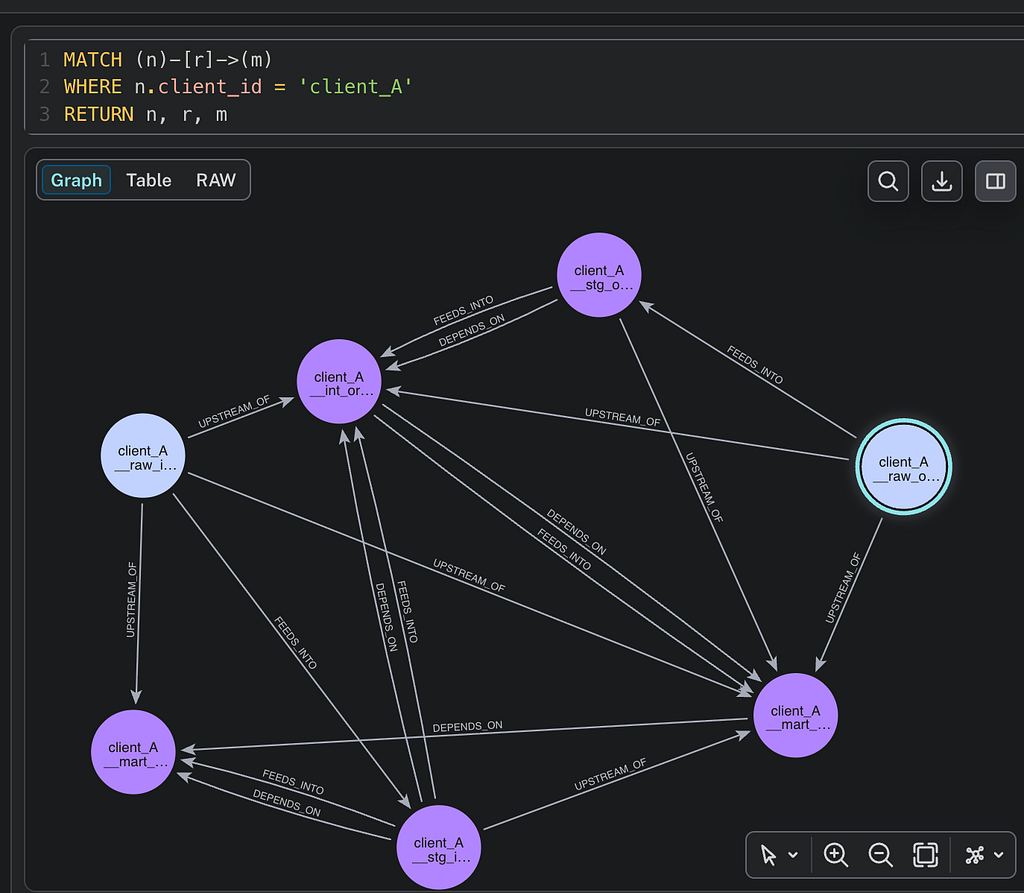
- Neo4j 5 Community (ports 7474 for browser, 7687 for Bolt) — the graph database holding the DBT lineage. Every DBT model and source for every client is a node. Edges are FEEDS_INTO (direct data flow), DEPENDS_ON (mirrors DBT ref() declarations), and UPSTREAM_OF (derived transitively). The graph has 84 nodes and 216 total edges.
- Airflow webserver (port 8082) and Airflow scheduler — together they run the 12 client DAGs. The webserver is exposed for the UI; the scheduler runs in a separate container sharing the same Airflow metadata database.
- Airflow init (one-shot container) — runs Alembic migrations on the Airflow metadata database and creates the admin user before the webserver starts.
- FastAPI backend (port 8001 external) — the investigation engine. Receives webhooks from Airflow, runs the LangGraph state machine synchronously, and serves REST endpoints for querying incidents and lineage. The investigation runs synchronously inside the POST handler — the Airflow on_failure_callback already runs in a subprocess, so blocking it for the 5–30 seconds the investigation takes does not hold up the scheduler. The trade-off is a simpler response contract and easier testing.
- MLflow (port 5050 external) — tracks every investigation as a run with params, metrics, and 3 artifacts. Uses SQLite as its backend store and a local volume for artifact storage.
- Gradio dashboard (port 7860) — 4-tab browser UI for browsing incidents, looking up lineage chains, and manually triggering investigations.
- MCP server (port 8090) — a lightweight FastAPI application that exposes 3 tools following the Model Context Protocol, making the investigation system accessible to Claude Code and similar LLM-powered developer tools.
The design rationale for this split: I kept Neo4j and PostgreSQL as separate databases rather than picking one for everything. Neo4j is the right tool for multi-hop graph traversal — asking “what are all the ancestors of this model up to 10 hops away” is a single Cypher MATCH with a variable-length path. Doing the same in PostgreSQL requires recursive CTEs that become difficult to reason about at depth. PostgreSQL is the right tool for relational queries: time-series run history, filtered DBT test results, incident indexing. Both databases play to their strengths.
Infrastructure as Code with Terraform
Beyond Docker Compose, the project includes a complete Terraform configuration in infra/docker/ using the kreuzwerker/docker provider. It manages 16 resources: 5 containers (PostgreSQL, Neo4j, MLflow, Airflow webserver and scheduler), 5 named volumes, 4 pulled images, and 1 bridge network.
The key design choice was using port offsets (+1 from the docker-compose defaults) so both stacks can run simultaneously on the same machine without conflicts. PostgreSQL gets port 5434 under Terraform vs 5433 under docker-compose; Neo4j browser gets 7475 vs 7474; and so on.
All sensitive values — passwords, API keys, Fernet keys — are declared as sensitive = true variables and read from terraform.tfvars, which is git-ignored. A terraform.tfvars.example template is committed for reference.
The full lifecycle is three commands:
terraform init
terraform plan # previews 16 resources across containers, volumes, images, network
terraform apply # provisions all infrastructure
terraform destroy

The Data Model
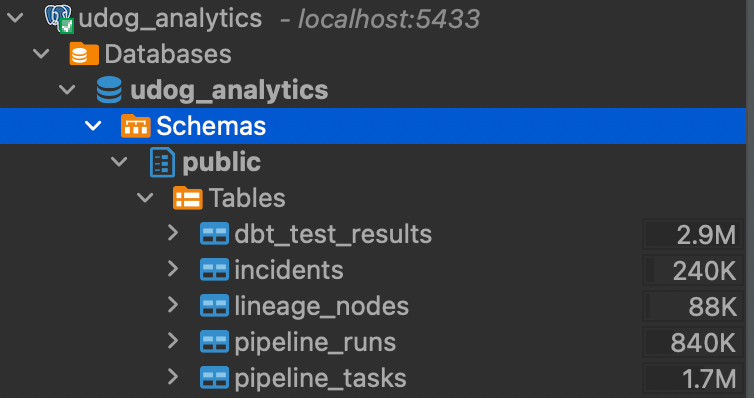
PostgreSQL holds 5 tables, all defined as SQLModel classes and migrated via Alembic.
Pipeline Runs (pipeline_runs):
- id — integer primary key
- dag_id — the Airflow DAG identifier, e.g. client_A__daily_pipeline
- run_id — unique Airflow run identifier string
- client_id — client_A through client_L
- status — enum: success, failed, running, skipped
- triggered_by — enum: schedule, manual, backfill
- started_at, ended_at — timestamps indexed for range queries
- duration_seconds — float, nullable
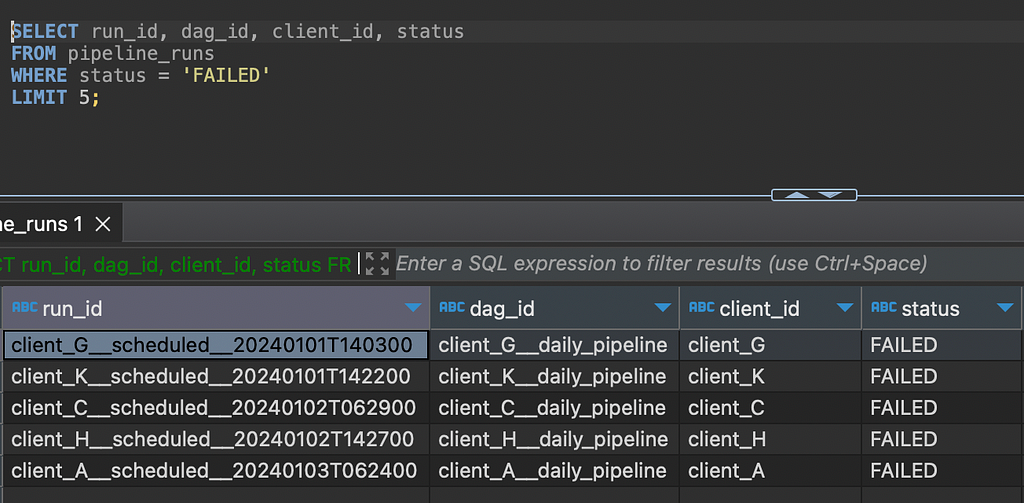
This table is the backbone of the PROFILE node. It holds 2,400 seeded rows covering a full calendar year of simulated runs across all 12 clients.
Pipeline Tasks (pipeline_tasks):
- id, run_id (FK), task_id — the Airflow task identifier
- status — task-level outcome
- started_at, ended_at, duration_seconds
- error_message — raw exception text, up to 4096 characters
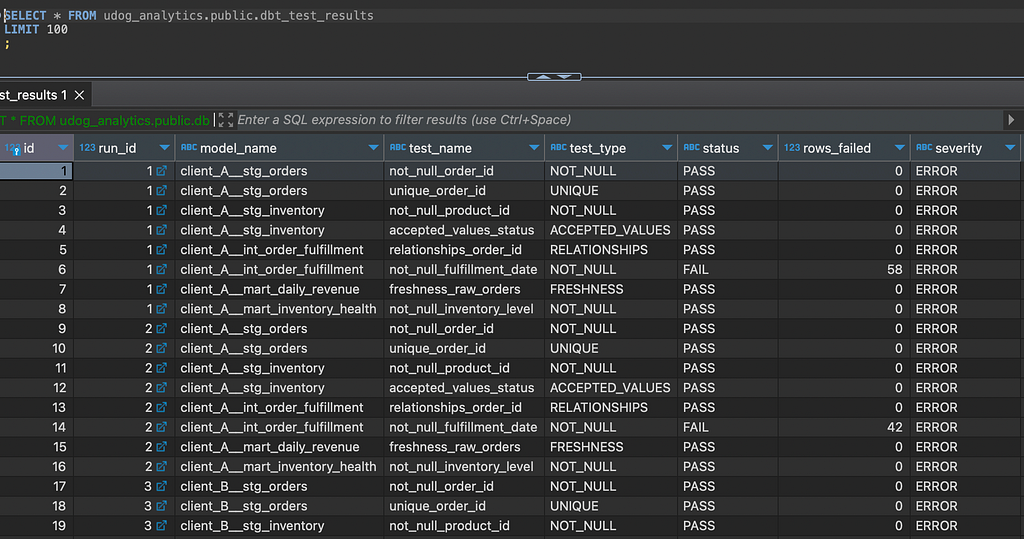
DBT Test Results (dbt_test_results):
- id, run_id (FK), model_name — which DBT model the test ran against
- test_name, test_type — e.g. not_null, accepted_values
- status — enum: pass, fail, warn
- rows_failed — integer count of failing rows
Lineage Nodes (lineage_nodes):
- id, node_name (unique), node_type — Source, Model, or Metric
- client_id, owner_team, layer — raw, staging, intermediate, or mart
- last_run_status, neo4j_node_id — bridge to the graph database
Incidents (incidents):
- id, run_id (FK), triggered_at
- affected_models — JSON array of model name strings
- root_cause_type — enum with 8 values: schema_change, null_check, freshness, timeout, dependency_failure, data_volume, flaky, unknown
- root_cause_summary, fix_suggestion — text fields
- hypothesis_chain — JSON array of the full LangGraph hypothesis objects
- severity — P1, P2, or P3
- status — open, investigating, resolved, false_positive
- mlflow_run_id — links back to the MLflow tracking server
- similar_incident_ids — JSON array of related incident IDs for deduplication
The incidents table serves double duty: it is the operational output of the agent (every investigation writes a row here) and the ground truth store for the GEval evaluation harness (50 seeded rows with known root causes).
Building the Lineage Graph in Neo4j
The DBT project has 5 model files per client: raw_orders (Source), raw_inventory (Source), stg_orders, stg_inventory, int_order_fulfillment, mart_daily_revenue, and mart_inventory_health. With 12 clients that comes to 84 nodes and, across FEEDS_INTO, DEPENDS_ON, and transitively-derived UPSTREAM_OF edges, 216 total relationships.
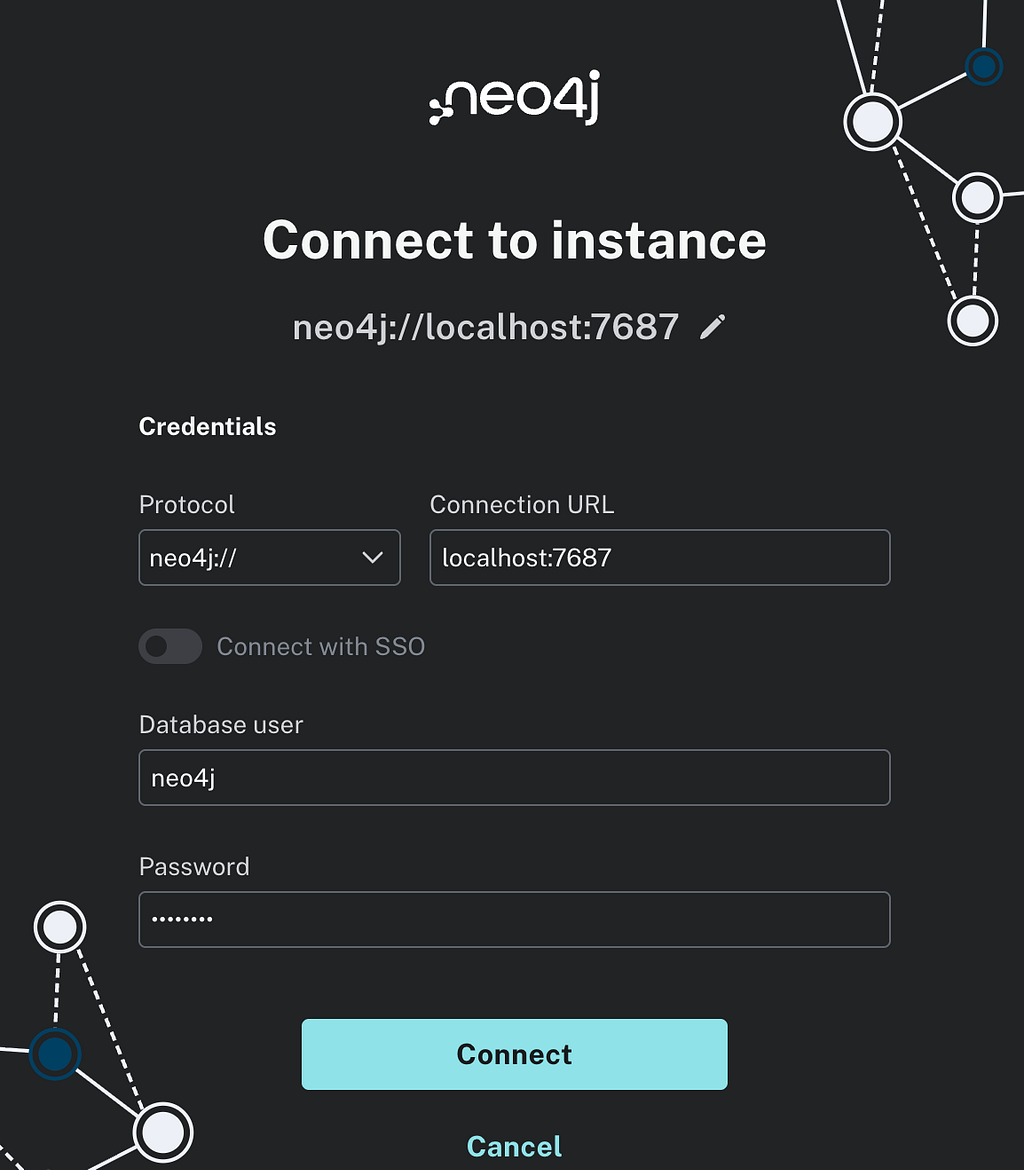
The loader (lineage/loader.py) runs at startup and is idempotent — it uses Cypher MERGE statements so re-running it never creates duplicates. The edge structure per client looks like this:
raw_orders → stg_orders → int_order_fulfillment → mart_daily_revenue
raw_inventory → stg_inventory → int_order_fulfillment
raw_inventory → stg_inventory → mart_inventory_health
The primary Cypher query the TRAVERSE node uses to walk upstream from any failed model is:
MATCH path = (ancestor)-[:FEEDS_INTO*1..10]->(target {name: $name})
RETURN
ancestor.name AS name,
labels(ancestor)[0] AS node_type,
ancestor.layer AS layer,
ancestor.client_id AS client_id,
length(path) AS depth
ORDER BY depth ASC
This returns every ancestor node ordered by hop distance. A failure on mart_daily_revenue returns int_order_fulfillment at depth 1, stg_orders and stg_inventory at depth 2, and raw_orders and raw_inventory at depth 3. The TRAVERSE node also runs the inverse query to get the downstream blast radius — any model that depends on the failed model and would be stale once it fails.
The loader also derives UPSTREAM_OF edges transitively using a second Cypher pass:
MATCH path = (upstream {client_id: $client_id})-[:FEEDS_INTO*2..]->(downstream {client_id: $client_id})
MERGE (upstream)-[:UPSTREAM_OF]->(downstream)
This pre-materialises multi-hop ancestor relationships so some queries can use the direct UPSTREAM_OF edge instead of a variable-length path scan.
The LangGraph Investigation Agent-All 6 Nodes in Detail
The agent is implemented as a LangGraph StateGraph. Every node receives the full AgentState TypedDict and returns an updated copy. The state flows linearly from TRIAGE through VERIFY, then branches conditionally: if the confidence threshold is met, the graph routes to REPORT; if not, it routes to CLARIFY.
The AgentState type definition:
class Hypothesis(TypedDict):
    rank: int
    hypothesis: str
    confidence: float
    verified: bool
    evidence_query: str | None
    class AgentState(TypedDict, total=False):
    # Webhook input
    run_id: str
    dag_id: str
    client_id: str
    failed_task_id: str
    exception_message: str
    # TRIAGE output
    error_type: str
    severity: str # P1 / P2 / P3
    # TRAVERSE output
    lineage_chain: list[dict[str, Any]]
    affected_models: list[str]
    # PROFILE output
    run_history: list[dict[str, Any]]
    dbt_failures: list[dict[str, Any]]
    # HYPOTHESIZE output
    hypotheses: list[Hypothesis]
    # VERIFY output
    verified_cause: str
    fix_suggestion: str
    # REPORT output
    incident_id: int | None
    mlflow_run_id: str | None
    # CLARIFY branch
    needs_clarification: bool
    clarification_msg: str
Node 1: TRIAGE
TRIAGE is a pure Python function with no external I/O — it runs in microseconds. Its job is to classify the exception message into one of 5 error types and assign a P1/P2/P3 severity.
Classification uses a list of compiled regex patterns evaluated in order. The first match wins:
_ERROR_PATTERNS: list[tuple[re.Pattern, str]] = [
(re.compile(r"schema|column.*(not found|missing|mismatch)", re.I), "schema_change"),
(re.compile(r"not.null|null.*check|null.*value", re.I), "null_check"),
(re.compile(r"fresh|stale|sla|last.*loaded", re.I), "freshness"),
(re.compile(r"timeout|timed out|exceed.*limit|pool.*exhaust", re.I), "timeout"),
(re.compile(r"upstream.*fail|dependent.*not.*material|cannot execute", re.I), "dependency"),
]
_MART_TASKS = {"run_mart_daily_revenue", "run_mart_inventory_health"}
_INT_TASKS = {"run_int_order_fulfillment"}
def triage_node(state: AgentState) -> AgentState:
  exception_msg = state.get("exception_message", "")
  failed_task_id = state.get("failed_task_id", "")
  error_type = _classify_error(exception_msg)
  severity = _assign_severity(error_type, failed_task_id)
  return {**state, "error_type": error_type, "severity": severity}
Severity rules: P1 for schema_change or freshness failures in the mart layer (these directly break client-facing reports). P2 for null_check or dependency failures in intermediate or mart. P3 for everything else — timeouts, unknowns, and staging failures that have not yet propagated downstream.
Node 2: TRAVERSE
TRAVERSE queries Neo4j to populate two fields: lineage_chain (the upstream ancestors of the failed model) and affected_models (the downstream blast radius). It derives the DBT model name from the Airflow task ID by stripping the “run_” prefix and prepending the client ID. A failure on task run_mart_daily_revenue for client_A maps to model client_A__mart_daily_revenue.
The node calls three lineage queries in sequence: get_upstream_chain to walk ancestors, get_downstream_impact to enumerate affected models, and find_root_failure to identify the topmost node in the affected set that has no upstream predecessors among the failed models. Root failure nodes are prepended to the lineage chain so Claude has them at the top of its context window in HYPOTHESIZE.
Node 3: PROFILE
PROFILE pulls two data sets from PostgreSQL using synchronous SQLModel sessions: the past 30 days of pipeline_run records for the failing client (up to 200 rows), and all dbt_test_result rows with status FAIL for the affected models within the same 30-day window (up to 100 rows).
These two data sets give Claude the statistical context it needs: how often has this client’s pipeline failed recently, and which DBT data quality tests have been failing on the models in the blast radius? The PROFILE node computes total_runs, failed_runs, and failure_rate from the run history and passes these as summary statistics into the HYPOTHESIZE prompt.
Node 4: HYPOTHESIZE
HYPOTHESIZE is where the LLM reasoning happens. It constructs a structured prompt from all prior node outputs and calls Claude claude-sonnet-4–6. The prompt instructs Claude to respond with a JSON array only — no prose — and to rank hypotheses by confidence descending.
def hypothesize_node(state: AgentState) -> AgentState:
      run_history  = state.get("run_history", [])
      total_runs   = len(run_history)
      failed_runs  = sum(1 for r in run_history if r.get("status") == "failed")
      failure_rate = failed_runs / total_runs if total_runs else 0.0

      prompt = _USER_TEMPLATE.format(
          max_hypotheses=settings.agent_max_hypotheses,
          dag_id=state.get("dag_id", ""),
          client_id=state.get("client_id", ""),
          failed_task_id=state.get("failed_task_id", ""),
          error_type=state.get("error_type", "unknown"),
          severity=state.get("severity", "P3"),
          exception_message=state.get("exception_message", ""),
          lineage_chain=json.dumps(state.get("lineage_chain", []), indent=2),
          affected_models=json.dumps(state.get("affected_models", []), indent=2),
          dbt_failures=json.dumps(state.get("dbt_failures", [])[:10], indent=2),
          total_runs=total_runs,
          failed_runs=failed_runs,
          failure_rate=failure_rate,
      )

      message = _client.messages.create(
          model=settings.anthropic_model,
          max_tokens=1024,
          system=_SYSTEM_PROMPT,
          messages=[{"role": "user", "content": prompt}],
      )

      raw = message.content[0].text.strip()
      # Strip markdown code fences if Claude wrapped the JSON
      if raw.startswith("```"):
          raw = raw.split("```", 2)[1]
          if raw.startswith("json"):
              raw = raw[4:]
          raw = raw.strip()

      hypotheses: list[Hypothesis] = json.loads(raw)
      for h in hypotheses:
          h.setdefault("verified", False)
          h.setdefault("evidence_query", None)

      return {**state, "hypotheses": hypotheses}
The system prompt sets Claude’s persona as a senior data reliability engineer at UDog Analytics and instructs it to respond with valid JSON only. The markdown fence stripping handles a common Claude behaviour where it wraps JSON responses in triple-backtick blocks even when told not to — this was particularly necessary when using Claude Haiku as the GEval judge model.
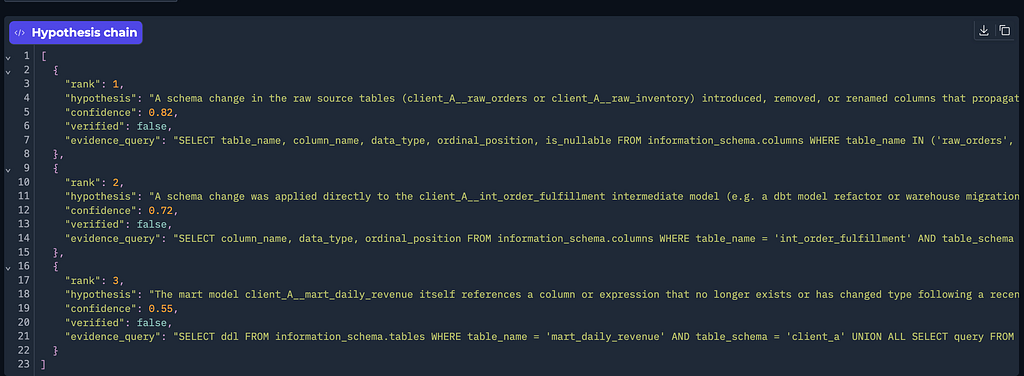
Each hypothesis in the returned array has a rank, a hypothesis string, a confidence float between 0 and 1, a verified boolean (initially false), and an evidence_query field — either null or a SQL SELECT statement that VERIFY can run to confirm the hypothesis.
Node 5: VERIFY
VERIFY iterates through the hypotheses and executes any non-null evidence_query against PostgreSQL. Before executing any query, it runs it through _is_safe_query(), which enforces that only SELECT statements are permitted.
_SELECT_ONLY = re.compile(r"^\s*SELECT\b", re.I)
  _CONFIDENCE_THRESHOLD = 0.55

  def _is_safe_query(query: str) -> bool:
      return bool(_SELECT_ONLY.match(query.strip()))

  def verify_node(state: AgentState) -> AgentState:
      hypotheses: list[Hypothesis] = state.get("hypotheses", [])
      updated: list[Hypothesis] = []

      with Session(_sync_engine) as session:
          for h in hypotheses:
              query = h.get("evidence_query")
              if query:
                  evidence = _run_evidence_query(query, session)
                  h = dict(h)
                  h["verified"] = bool(evidence and "error" not in evidence)
              updated.append(h)

      verified_cause, confidence = _pick_verified_cause(updated)
      needs_clarification = confidence < _CONFIDENCE_THRESHOLD
      fix_suggestion = _build_fix_suggestion(verified_cause, state)

      return {
          **state,
          "hypotheses": updated,
          "verified_cause": verified_cause,
          "fix_suggestion": fix_suggestion,
          "needs_clarification": needs_clarification,
      }
The confidence threshold is 0.55. If the best hypothesis after SQL verification still has confidence below that value, needs_clarification is set to True and the graph routes to CLARIFY instead of REPORT. Fix suggestions are generated from a template dictionary keyed on the verified_cause string — for example, a schema_change fix suggests updating the failing model’s SQL to align with the new upstream schema and re-running the staging layer.
Node 6: REPORT
REPORT writes the complete incident record to the incidents table in PostgreSQL. It maps the severity string (P1/P2/P3) and verified_cause string to their enum equivalents, builds a human-readable root_cause_summary string, and persists the full hypothesis chain as a JSON column.
The REPORT node also links the incident to its MLflow run via the mlflow_run_id field on the AgentState, which was set by the FastAPI webhook handler before invoking the graph. An important implementation detail: when the webhook receives a simulated or new run_id that does not exist in pipeline_runs, a helper function _ensure_pipeline_run() creates that record first. Without this, the _resolve_run_id lookup in REPORT silently falls back to run_id=1, causing GET /investigations/{run_id} to return 404 for any non-seeded investigation.
The CLARIFY Node
CLARIFY is reached when confidence is too low to commit to a root cause. It extracts the top hypothesis by confidence, formats a clarification message including the hypothesis text and confidence percentage, and writes it to state. The graph terminates after CLARIFY — no incident row is written. The FastAPI response signals status: “clarification_needed” back to the Airflow callback, and the Gradio dashboard surfaces the clarification message for the on-call engineer to act on.
The LangGraph Graph Assembly
The graph wires the 6 nodes with linear edges for the happy path and a conditional branch after VERIFY:
def _route_after_verify(state: AgentState) -> str:
      if state.get("needs_clarification", False):
          return "clarify"
      return "report"

  def build_investigation_graph() -> StateGraph:
      graph = StateGraph(AgentState)
      graph.add_node("triage",      triage_node)
      graph.add_node("traverse",    traverse_node)
      graph.add_node("profile",     profile_node)
      graph.add_node("hypothesize", hypothesize_node)
      graph.add_node("verify",      verify_node_with_mlflow)
      graph.add_node("report",      report_node)
      graph.add_node("clarify",     clarify_node)

      graph.add_edge(START, "triage")
      graph.add_edge("triage",      "traverse")
      graph.add_edge("traverse",    "profile")
      graph.add_edge("profile",     "hypothesize")
      graph.add_edge("hypothesize", "verify")

      graph.add_conditional_edges(
          "verify",
          _route_after_verify,
          {"report": "report", "clarify": "clarify"},
      )

      graph.add_edge("report",  END)
      graph.add_edge("clarify", END)
      return graph.compile()

  investigation_graph = build_investigation_graph()
The compiled graph is a module-level singleton. The FastAPI webhook handler imports it directly and calls investigation_graph.invoke(initial_state) — no instantiation overhead per request.
The FastAPI Backend
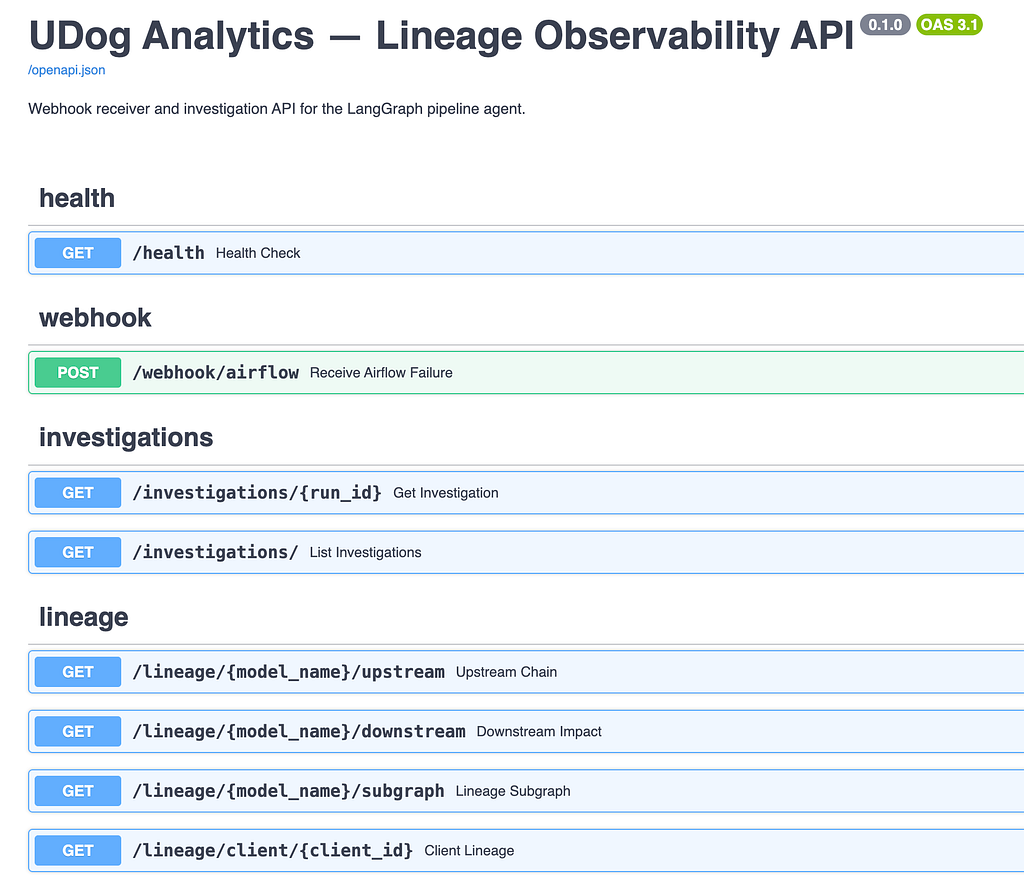
The webhook receiver at POST /webhook/airflow is the entry point for all investigations. It accepts the AirflowWebhookPayload, ensures the pipeline run record exists in PostgreSQL, constructs the initial AgentState, starts an MLflow run via InvestigationTracker, invokes the LangGraph graph synchronously, logs the final state to MLflow, and returns the WebhookResponse. The route returns HTTP 202 Accepted to signal that the work has been acknowledged, but the investigation itself completes before the response is sent.
The Airflow on_failure_callback that fires the webhook:
def _fire_webhook(context: dict) -> None:
      ti = context["task_instance"]
      payload = {
          "dag_id":          context["dag"].dag_id,
          "run_id":          context["run_id"],
          "client_id":       context["dag"].dag_id.split("__")[0],
          "task_id":         ti.task_id,
          "execution_date":  context["execution_date"].isoformat(),
          "exception":       str(context.get("exception", "")),
          "log_url":         ti.log_url,
      }
      try:
          resp = requests.post(
              f"{BACKEND_URL}/webhook/airflow",
              json=payload,
              headers={"X-API-Key": API_KEY},
              timeout=10,
          )
          resp.raise_for_status()
          log.info("Webhook fired successfully: %s", resp.json())
      except requests.RequestException as exc:
          log.error("Failed to fire investigation webhook: %s", exc)
The client_id is derived by splitting the DAG ID on the double underscore separator — client_A__daily_pipeline becomes client_A. This convention is baked into the DAG factory that generates all 12 DAGs from a single _make_dag(client_id) function.
Authentication uses a shared API key passed as the X-API-Key header. The FastAPI deps.py verifies this on every route. The key is mounted from a .env file via pydantic-settings. No secrets are hardcoded anywhere in the source.
Additional REST routes handle querying: GET /investigations/ (list with client_id and days filters), GET /investigations/{run_id} (fetch by Airflow run ID), and GET /lineage/{model_name}/upstream|downstream|subgraph.
MLflow Observability
Every investigation produces one MLflow run with the following structure:
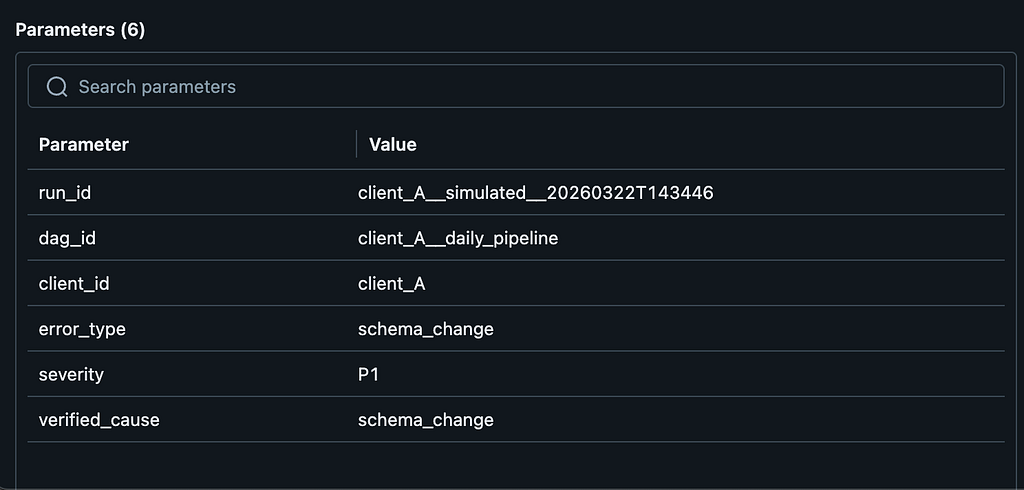
Params (logged at run start and updated after triage):
• run_id, dag_id, client_id — webhook identifiers
• error_type, severity, verified_cause — set after the relevant nodes complete
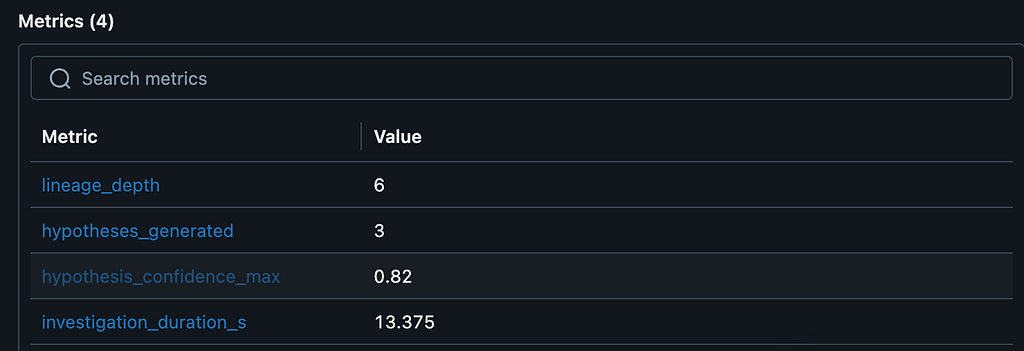
Metrics:
• lineage_depth — number of nodes in the upstream lineage chain
• hypotheses_generated — count of hypotheses Claude produced
• hypothesis_confidence_max — highest confidence value across all hypotheses
• investigation_duration_s — wall-clock time from MLflow run start to log_final_state call
Artifacts (3 files logged to the run):
- full_incident_report.json — a flattened serialisation of the complete AgentState: all lineage nodes, the full run history summary, every hypothesis, the verified cause, and the fix suggestion. This is the primary debugging artifact.
- hypothesis_chain.json — just the hypotheses list, making it easy to compare hypothesis quality across different incident types without loading the full report.
- lineage_subgraph.graphml — a NetworkX directed graph of the lineage chain and affected models exported in GraphML format. This can be loaded directly into Gephi or any other graph analysis tool for visual exploration.
Using MLflow for agent observability rather than just for ML model training turned out to be a natural fit. The params/metrics/artifacts structure maps cleanly onto an investigation: params are the context the agent received, metrics quantify the depth and quality of the investigation, and artifacts are the structured outputs. The MLflow UI gives you a dashboard where you can sort investigations by hypothesis_confidence_max to find the uncertain cases, or by investigation_duration_s to find the slow ones.
The evaluation harness logs its results to a separate geval-evaluation experiment in the same MLflow instance, so you can compare individual investigation quality against aggregate evaluation metrics in one place.
The Gradio Dashboard
The Gradio dashboard has 4 tabs:
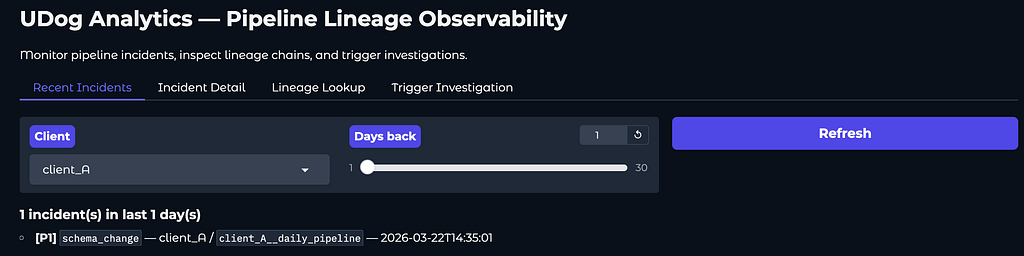
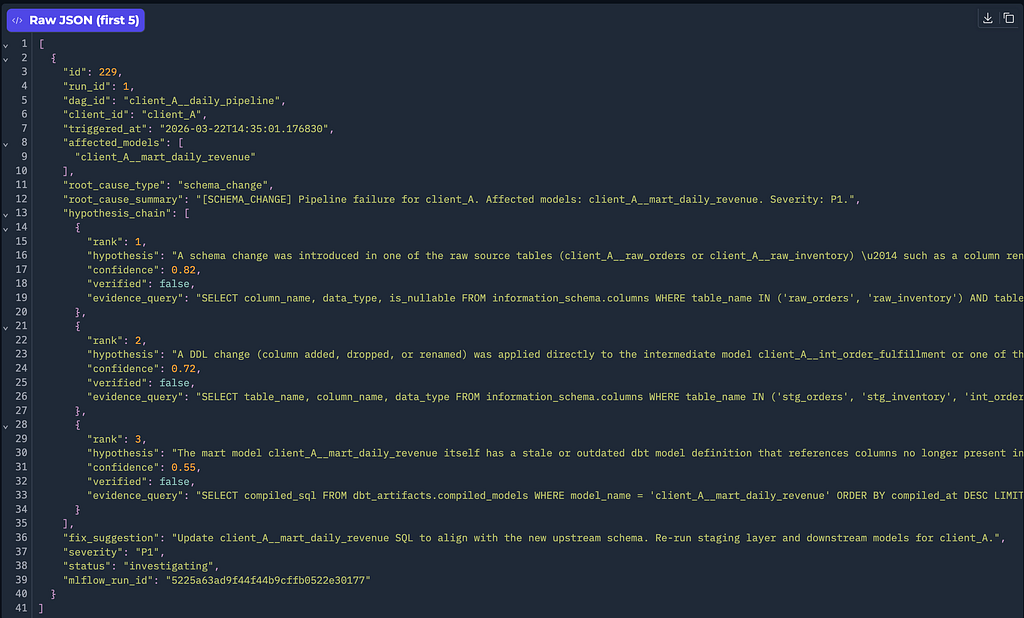
Tab 1: Recent Incidents. A dropdown to select a client (or “All clients”) and a day-range slider from 1 to 30. On refresh, it fetches up to 50 incidents from the backend and renders a severity-tagged summary list. The first 5 incidents are also shown as raw JSON in a code block for debugging.
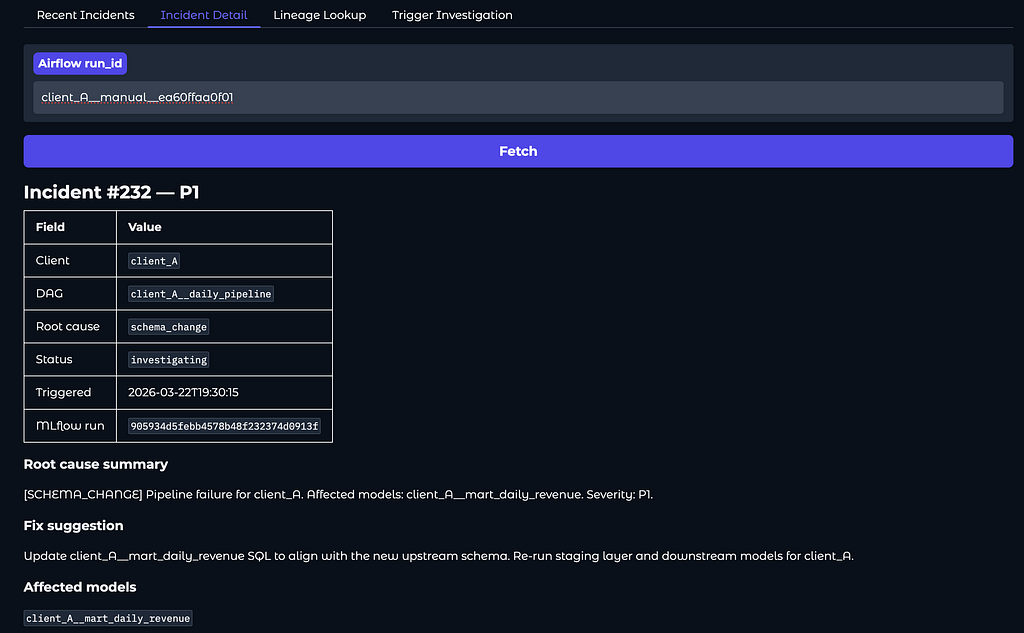
Tab 2: Incident Detail. A text input for an Airflow run_id. On fetch, it renders a full incident report including severity, root cause type, affected models, root cause summary, and fix suggestion. Below it shows the hypothesis chain as JSON — the ranked list of hypotheses Claude generated, with their confidence scores and verification status.
Tab 3: Lineage Lookup. A model name input (e.g. client_A__mart_daily_revenue), a direction dropdown (upstream ancestors, downstream blast radius, or full subgraph), and a depth slider. Returns the lineage chain as JSON, which is useful for ad hoc lineage exploration without opening the Neo4j browser.
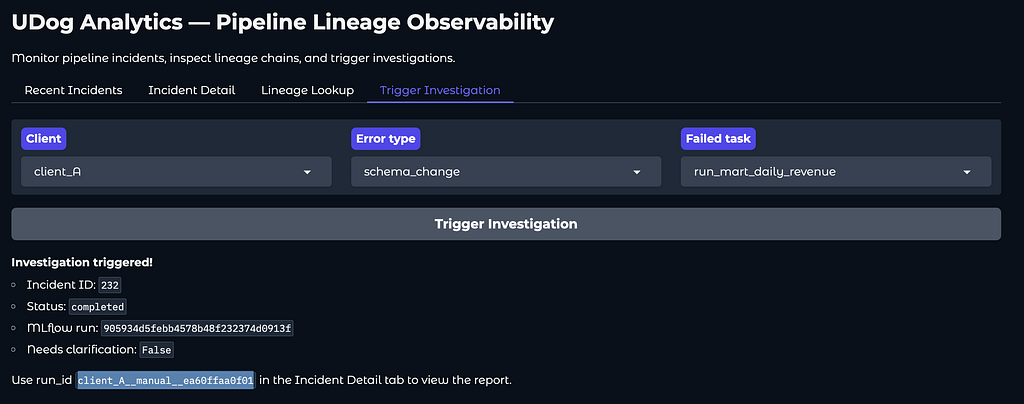
Tab 4: Trigger Investigation. A manual investigation trigger for testing and demonstration. Select a client, an error type, and a failing task, then click the button. The dashboard generates a synthetic run_id, fires the webhook, and shows the response including the incident ID and MLflow run ID.
The MCP Server
MCP stands for Model Context Protocol — a standard for exposing tools to LLM-powered developer assistants in a way they can discover and invoke programmatically. The idea is that instead of writing a one-off script to query your investigation system, you register it as an MCP tool and any compatible assistant (Claude Code, for example) can call it directly from a conversation.
For data engineers this is significant. It means Claude Code can answer questions like “what failed in client_B’s pipeline yesterday?” or “show me the upstream lineage for mart_daily_revenue” without any copy-pasting of run IDs or manually navigating the Gradio UI. The engineer describes what they want; the assistant calls the right tool and surfaces the structured result.
The MCP server exposes 3 tools at port 8090:
Tool 1: investigate. Takes a run_id and optionally client_id, dag_id, task_id, and exception. First checks whether an investigation for this run_id already exists in the backend (GET /investigations/{run_id}). If it does, returns the cached report. If not, and if client_id and dag_id are provided, fires a synthetic webhook to trigger a new investigation. This tool is idempotent — calling it twice on the same run_id returns the same report.
Tool 2: lineage_lookup. Takes a model_name, a direction (upstream, downstream, or subgraph), and a depth. Proxies to the corresponding FastAPI lineage route. Returns the full lineage chain as a JSON object that the LLM can reason about inline.
Tool 3: incident_history. Takes a client_id, a days lookback window, and a result limit. Returns recent incidents for the client filtered by the time window. Useful for patterns like “has client_F had more schema_change failures than usual this week?”
All three tools are thin proxies over the FastAPI backend — they add no logic of their own, just translate MCP-format requests into backend HTTP calls and return the results. The MCP manifest is served at the root GET / endpoint and declares the tool schemas in JSON Schema format.

GEval Evaluation Harness
The hardest part of building an AI agent is not making it produce output — it is making it produce correct output, and knowing when it does not. For a data reliability agent, correctness means: did it identify the right root cause, did it trace the lineage correctly, and did it suggest a useful fix?
I used the GEval pattern — LLM-as-judge evaluation — implemented directly rather than through a third-party library. The harness lives in backend/app/evaluation/harness.py and runs against 50 golden incidents seeded into the PostgreSQL incidents table via scripts/seed.py. Each golden incident has a known root_cause_type, a known list of affected models (the first entry being the true root model), and a known fix_suggestion written by a human.
The 50 incidents are distributed across all 5 failure patterns (schema_change, null_check, freshness, timeout, dependency), all 12 clients, and both mart-layer and intermediate-layer failures, giving a representative sample of the full failure space the agent encounters.
To reduce evaluation cost, the LLM judge uses Claude Haiku (claude-haiku-4–5–20251001) rather than Sonnet. The judge is called once per incident for the Fix Relevance metric; Root Cause Accuracy and Lineage Correctness are computed without LLM calls. Running 50 cases with the Haiku judge costs approximately $0.50.
Three primary metrics govern whether the harness passes:
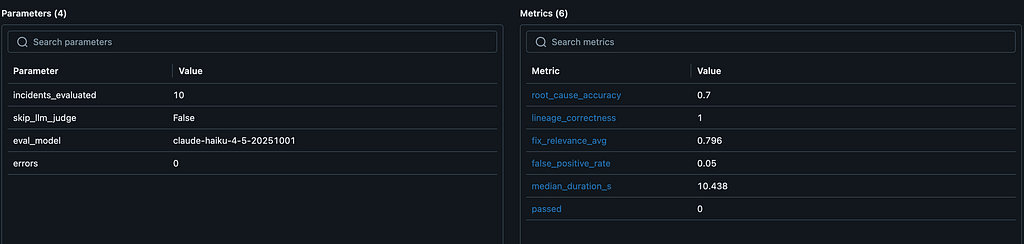
Metric 1: Root Cause Accuracy (target ≥ 80%). This is an exact string match between the agent’s verified_cause field and the golden ground truth root_cause_type. There is no partial credit — if the agent returns “timeout” for a “schema_change” incident, it counts as a miss. This is the strictest metric and the hardest to game, because the classification taxonomy is closed: 8 possible values, one correct answer per incident.
Metric 2: Lineage Correctness (target ≥ 90%). This checks whether the true root model name (the first entry in the golden incident’s affected_models list) appears anywhere in the agent’s lineage_chain output. The match is a substring check to handle naming variations. This is more lenient than Root Cause Accuracy because it only requires that the lineage traversal reached the right part of the graph, not that it identified the precise cause.
Metric 3: Fix Relevance (target ≥ 75%). This is the LLM-as-judge metric. Claude Haiku is given the agent’s fix_suggestion and the golden fix_suggestion side by side and asked to score the agent’s fix from 0.0 to 1.0 on relevance and correctness. The prompt asks Claude to respond with a JSON object containing a score and a brief reason. The average of these scores across all 50 incidents must reach 75%. This metric captures whether the fix is actionable, not just whether it mentions the right error type.
Results are logged to the geval-evaluation MLflow experiment after every harness run, making it straightforward to track evaluation quality across prompt iterations.
Unit Tests
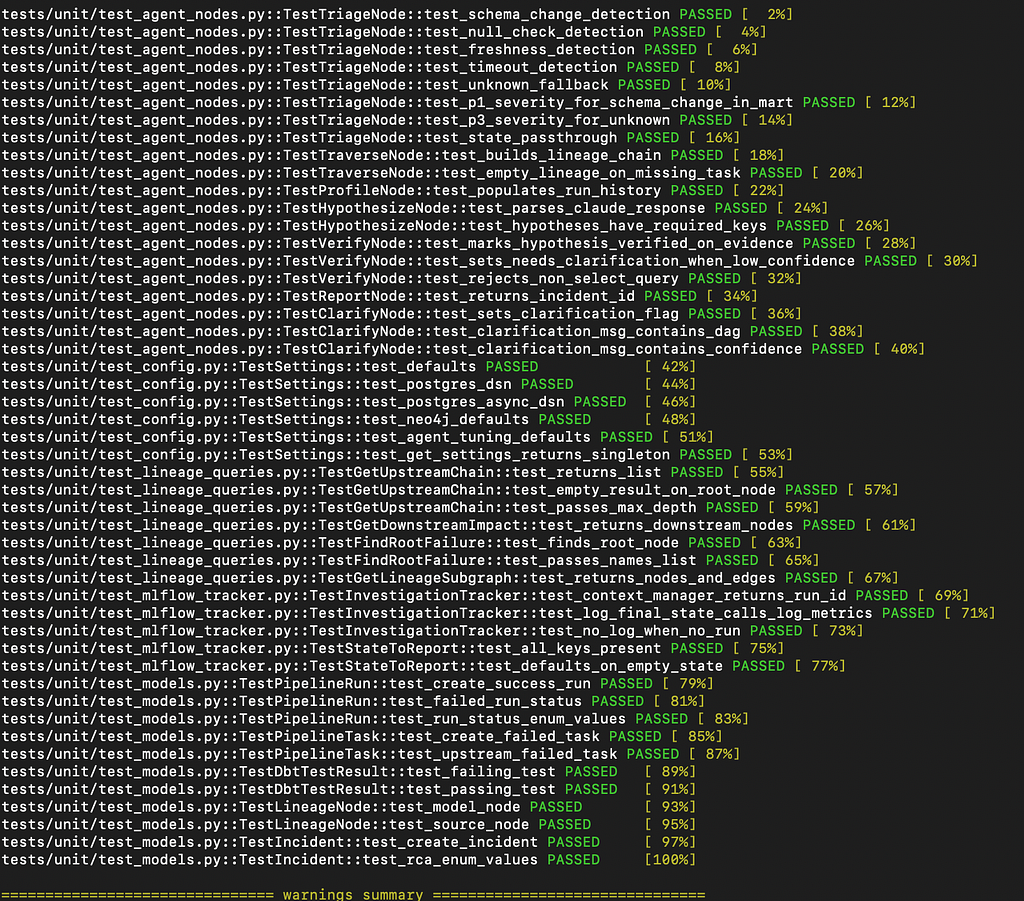
Integration Tests

Results and Lessons
The system does what it was designed to do: take a structured failure signal from Airflow and produce a structured root cause report without human intervention, in under 30 seconds, with traceable reasoning.
A few things I would do differently:
The synchronous webhook handler keeps the response contract simple but means the Airflow callback waits for the full investigation. For a production deployment where investigations routinely exceed 30 seconds or where multiple failures arrive simultaneously, moving to a background task queue (Celery or similar) with a polling endpoint would be the right call.
The VERIFY node’s evidence queries are generated by Claude against a database schema it can’t see directly — it infers column names from the hypothesis context. This works well for common patterns but fails on queries that reference columns that exist in a different form than Claude expects. Passing an explicit schema summary in the HYPOTHESIZE prompt would improve verification accuracy.
The Terraform configuration covers the infrastructure services but not the custom-built containers (backend, Gradio, MCP server), since those require docker build context. A complete Terraform solution would use the docker_registry_image resource to build and push images to a local registry first. For this project, the split is clean: Terraform owns the data infrastructure, Docker Compose owns the full application stack.
The GEval harness runs 50 cases in a single synchronous pass. Parallelising across incidents with a thread pool would cut evaluation wall-clock time by 5–10x.
If you’re looking for freelance or consultancy work on data pipelines, AI systems, or real-time platforms, reach out to me on X, or via email.
And, if this saved you time or sparked an idea, consider sponsoring me on GitHub. Thank you!
GitHub: https://github.com/dogukannulu
Email: dogukannulu@gmail.com