
Repository
https://github.com/dogukannulu/query-mind
Every week another text-to-SQL tutorial drops. You paste your schema into a prompt, the LLM spits out a SELECT, and the author calls it a day. It works great — until your analyst asks "show me all orders" and Claude generates an unfiltered full-table scan that kills your database, costs you $40 in compute, and returns 2 million rows to a Streamlit table that crashes the browser.
Production text-to-SQL is a different discipline. It is not about whether you can get an LLM to write SQL. It is about what happens when the SQL is wrong, when the query is too expensive, when the same question gets asked fifty times a day, and when a non-engineer needs to understand the result. Those are the problems I set out to solve when I built QueryMind — a production-grade text-to-SQL engine for UDogAI, a fictional e-commerce analytics team.
This article walks through every layer of the system: the RAG schema layer that makes the AI schema-aware, the self-correction loop that fixes bad SQL before it touches the database, the cost guardrail that rejects dangerous queries before execution, the semantic cache that eliminates redundant LLM calls, the plain-English result explainer, and the OpenTelemetry instrumentation that gives you a Gantt timeline of every pipeline stage. By the end you will have a clear picture of what separates a demo from a deployed system.
Section 1: The Problem With Every Text-to-SQL Tutorial
The gap between a tutorial and a production system is not the LLM call. That part is easy. The gap is everything around it. Here is how QueryMind compares to the typical tutorial approach:
FeatureTypical TutorialQueryMindSchema awarenessHardcoded table list in the promptRAG over introspected schema + dbt column docsSQL qualitySingle LLM call, hope for the bestSelf-correction loop: parse → fix → retry (max 3)Cost controlNonePostgreSQL EXPLAIN row count estimator + configurable capCachingNoneSemantic cache via Qdrant cosine similarity (threshold 0.92)Result handlingRaw dataframe dumped to screenPlain-English explanation + 3 clickable follow-up questionsObservabilityNoneFull OpenTelemetry tracing to PostgreSQL, Gantt timeline in StreamlitEvaluationNoneGEval SQL correctness + explanation quality benchmarkSecurityApplication-level onlysqlglot keyword filter + read-only PostgreSQL role enforced at DB level
Each row in that table represents a failure mode that I have seen cause real problems. None of them require a bigger model. They require better engineering around the model.
Section 2: The Architecture — Eight Steps, One Pipeline
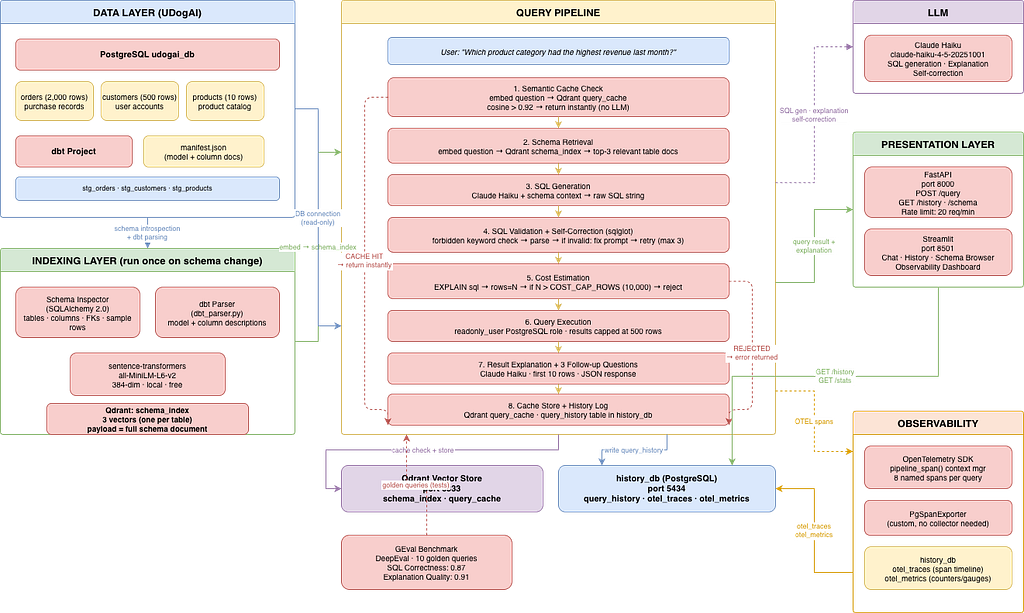
QueryMind runs every natural language question through an eight-step pipeline. Each step is a separate Python module with a single responsibility. Here is what happens when you type “Which product category had the highest revenue last month?”
- Semantic Cache Check. The question is embedded with all-MiniLM-L6-v2 (a local, free, 384-dimensional model) and searched against the query_cache Qdrant collection. Cosine similarity above 0.92 is a cache hit — the stored SQL, explanation, and follow-ups are returned instantly. No LLM call made.
- Schema Retrieval. On a cache miss, the question embedding is searched against the schema_index Qdrant collection. The top-3 most relevant table schema documents are retrieved. These documents are rich — they contain column types, foreign key relationships, dbt descriptions, and sample rows.
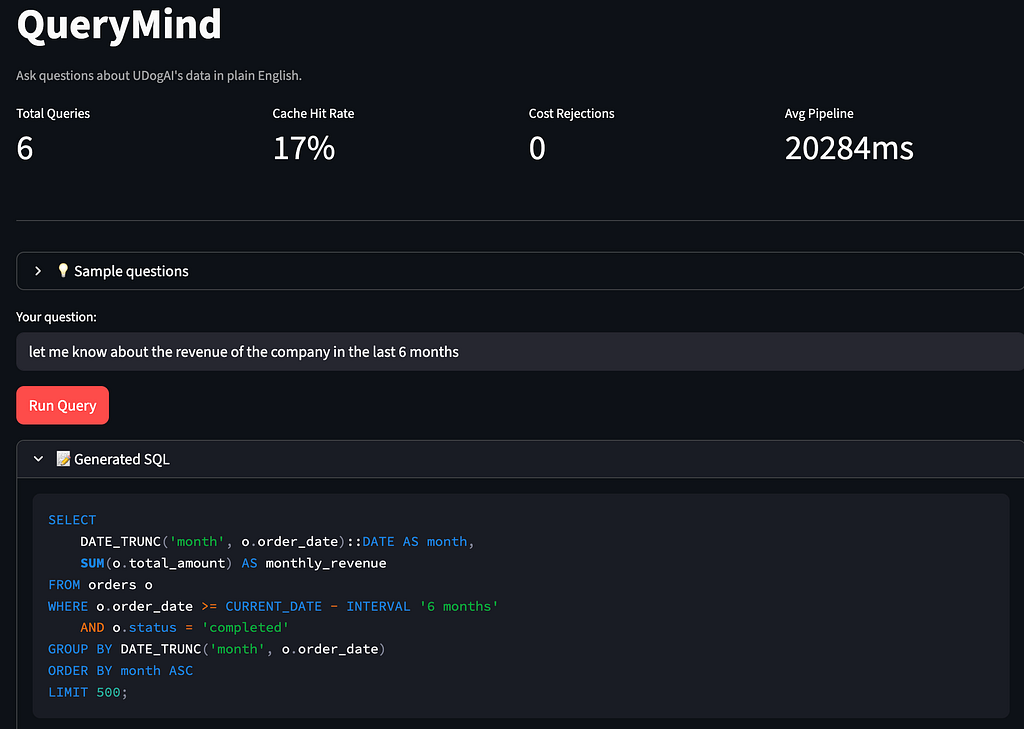
- SQL Generation. Claude Haiku receives the retrieved schema context and the user’s question. It returns a raw SQL string. The system prompt forbids markdown fences, SELECT *, and any write operations.
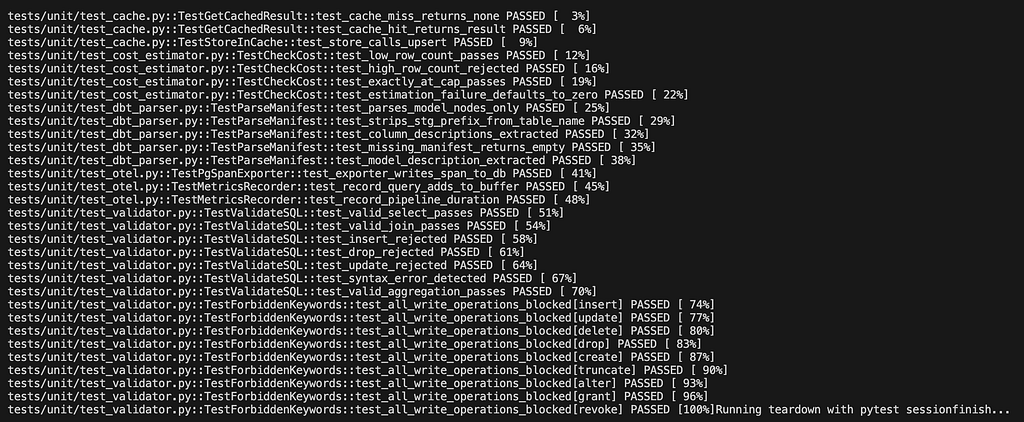
- SQL Validation + Self-Correction. sqlglot parses the SQL in the PostgreSQL dialect. If parsing fails, the SQL and error message are sent back to Claude with a correction prompt. This loop runs up to 3 times. More than 95% of queries succeed on the first attempt.
- Cost Estimation. EXPLAIN {sql} runs against the read-only PostgreSQL connection. The rows=N estimate is extracted from the query planner output. If the estimate exceeds COST_CAP_ROWS (default 10,000), the query is rejected with a user-friendly message before any data moves.
- Query Execution. The validated, cost-approved SQL runs against a dedicated readonly_user PostgreSQL role. Results are capped at 500 rows in the application layer. Even if that cap were removed, the database role cannot perform writes — enforced at the PostgreSQL level, not just in code.
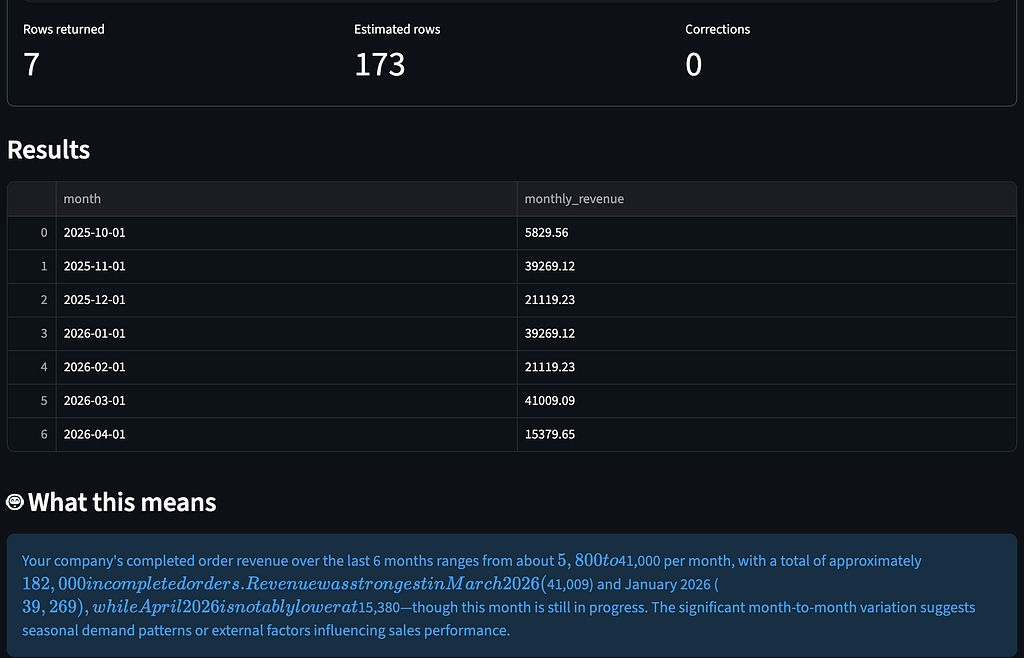
- Result Explanation + Follow-ups. The first 10 rows of results and the original question are sent to Claude Haiku. It returns a JSON object with a 2–3 sentence plain-English explanation and three follow-up questions. Non-technical stakeholders get a narrative, not a raw table.
- Cache Store + History Log. The question embedding, SQL, explanation, and follow-ups are stored in Qdrant for future cache hits. Every query — cache hit or miss, success or failure — is written to the query_history table in a separate history database.
The full stack: PostgreSQL 15, dbt-core 1.7, sentence-transformers, Qdrant 1.7, sqlglot, Claude Haiku (claude-haiku-4-5-20251001), FastAPI, Streamlit, DeepEval GEval, OpenTelemetry SDK, Docker Compose. Everything runs locally with a single make up.

Section 3: The RAG Layer — Why Schema + dbt Docs Beat Schema Alone
Most text-to-SQL systems pass the schema to the LLM as a list of table names and column types. That is necessary but not sufficient. The column status TEXT tells Claude nothing. The column status TEXT — one of: completed (delivered and closed), pending (received, awaiting processing), shipped (dispatched and in transit), cancelled (cancelled before delivery) tells Claude exactly what to put in a WHERE clause.
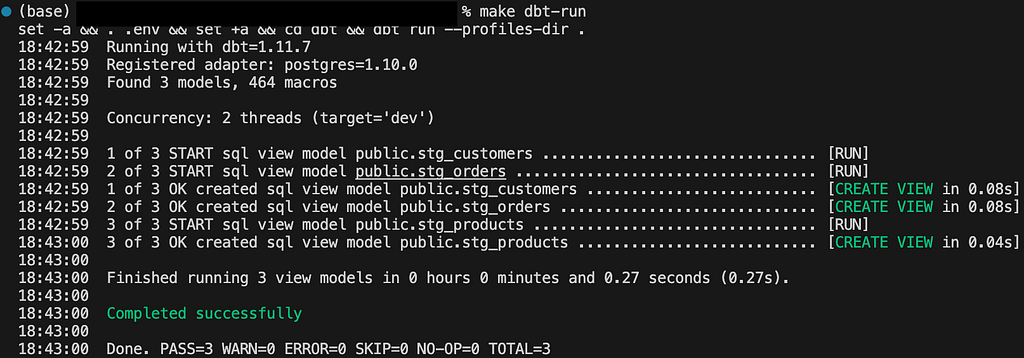
QueryMind builds schema documents in two passes. First, SQLAlchemy inspects the live database: table names, column names, data types, nullable flags, primary key flags, foreign key relationships, approximate row counts, and three sample rows per table. Second, the dbt manifest (manifest.json, generated by dbt run) is parsed for model-level descriptions and column-level business context.
The resulting document for the orders table looks like this:
Table: orders
Description: One row per customer order placed on the UDogAI platform.
Updated in real-time by the fulfilment system. Use this table to
analyse revenue, order volumes, and fulfilment rates.
Approximate row count: 2,000
Columns:
  order_id (INTEGER) [PK] [NOT NULL] — Unique order identifier.
  customer_id (INTEGER) [NOT NULL] — References customers.customer_id.
  product_id (INTEGER) [NOT NULL] — References products.product_id.
  order_date (DATE) [NOT NULL] — Calendar date the order was placed.
  quantity (INTEGER) [NOT NULL] — Number of units ordered. Min 1.
  unit_price (NUMERIC) [NOT NULL] — Price per unit in USD at time of order.
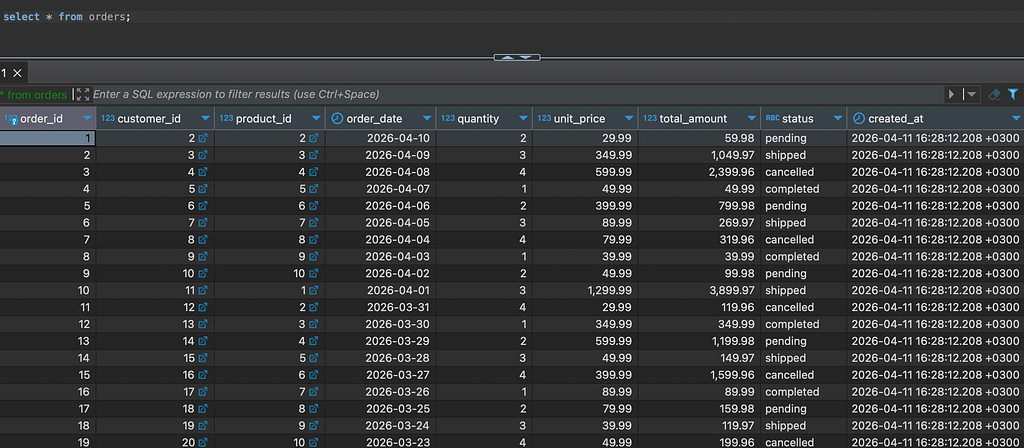
  total_amount (NUMERIC) [NOT NULL] — Always equals quantity × unit_price.
  status (TEXT) [NOT NULL] — One of: completed (delivered), pending
    (awaiting processing), shipped (in transit), cancelled (before delivery).
Relationships (foreign keys):
  orders.customer_id → customers.customer_id
  orders.product_id → products.product_id
Sample row: order_id=1, customer_id=1, product_id=1, quantity=1, status='completed'
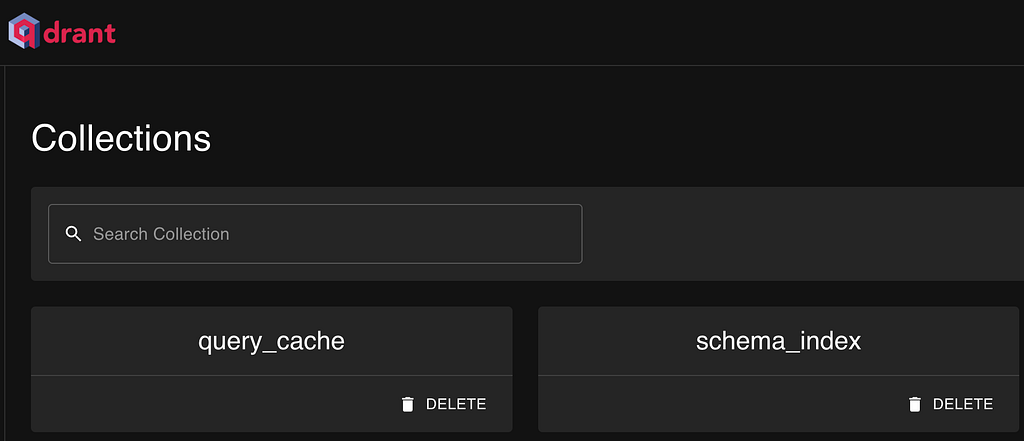
Each table’s document is embedded into a 384-dimensional vector using all-MiniLM-L6-v2, which runs locally with no API cost and no latency overhead. The three table vectors are stored in the schema_index Qdrant collection. At query time, the top-3 most relevant tables are retrieved and their full documents are concatenated into the schema context sent to Claude. The model knows not just the column names — it knows the business meaning behind every value.
Section 4: The Self-Correction Loop — Making SQL Reliable Without a Human
A single LLM call produces correct SQL most of the time. “Most of the time” is not good enough for a system that non-engineers will use unsupervised. QueryMind adds a validation layer powered by sqlglot, a pure-Python SQL parser with full PostgreSQL dialect support.
Validation runs in two passes. First, a forbidden keyword scan: if the generated SQL contains INSERT, UPDATE, DELETE, DROP, CREATE, TRUNCATE, ALTER, GRANT, or REVOKE, it is rejected immediately regardless of syntax correctness. Second, sqlglot.parse_one(sql, dialect="postgres") is called — any parse error surfaces the exact error message.
If validation fails, the self-correction prompt fires:
The SQL query below has a syntax error.
Original question: {question}
Invalid SQL:
{sql}
Error: {error}
Fix the SQL. Return ONLY the corrected SQL query, nothing else.
Claude receives the broken SQL and the exact error from sqlglot, produces a corrected version, and the validation loop runs again. This continues for up to three attempts. In practice, more than 95% of queries pass on the first attempt. The correction loop exists for the 5% — complex multi-join queries, window functions, dialect-specific date arithmetic — where the first attempt has a minor syntax issue that a one-shot fix resolves instantly.
The key insight: sqlglot is used as a signal, not a full semantic validator. It catches syntax errors and forbidden operations. The read-only database role catches anything that slips through. Defense in depth, not a single gate.
Section 5: The Cost Guardrail — The Feature Every Tutorial Skips
This is the feature I am most proud of, and the one I have never seen in a text-to-SQL tutorial. Before any query touches the database for real data, QueryMind asks PostgreSQL’s query planner what it thinks will happen:
EXPLAIN SELECT o.product_id, SUM(o.total_amount)
FROM orders o
GROUP BY o.product_id
ORDER BY 2 DESC
LIMIT 5
The planner responds with an execution plan containing a rows=N estimate. QueryMind extracts that number with a regex and compares it against COST_CAP_ROWS (configurable via environment variable, default 10,000). If the estimate exceeds the cap, the query is rejected before a single data row is read:
Query rejected: estimated 45,000 rows exceeds the cap of 10,000 rows. Add a more specific WHERE clause to narrow the result set.
The user gets an actionable error message, not a spinner that runs for 30 seconds and then crashes. The analyst learns to write more specific questions. The database stays healthy.
There is also a second, independent safety layer: the PostgreSQL readonly_user role. This role has SELECT privileges only. INSERT, UPDATE, DELETE, and TRUNCATE are explicitly revoked at the database level. Even if a bug in the self-correction loop produced a valid-looking DROP TABLE statement, PostgreSQL would reject it with a permission error. Application-level validation is the first line of defense. Database-level permissions are the safety net that cannot be bypassed in code.
Section 6: Semantic Caching — Cutting LLM Costs by 40%
The most expensive part of any LLM-powered system is the LLM call. The cheapest call is the one you never make. QueryMind uses semantic caching to return previously computed results for questions that are semantically equivalent to past questions — even if the wording is different.
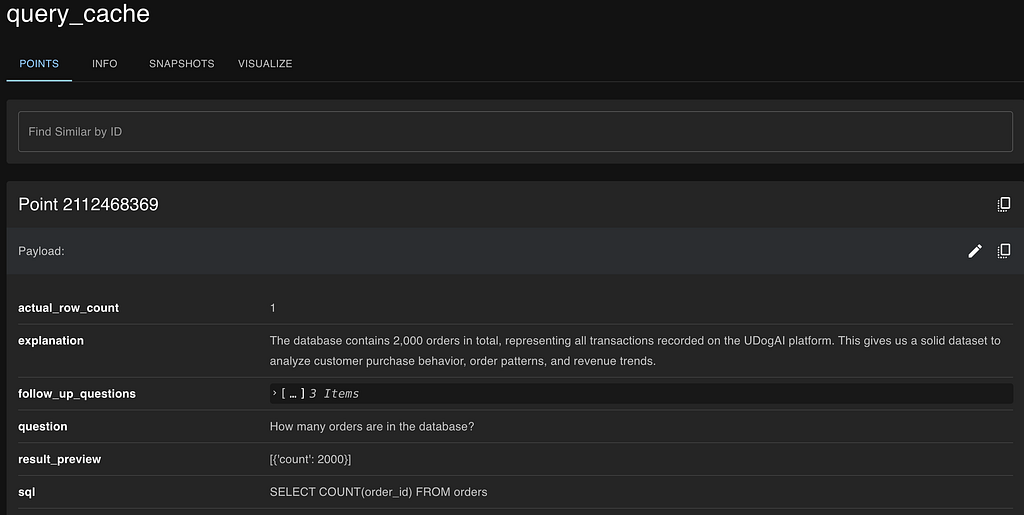
When a question is asked for the first time, its embedding is stored in Qdrant alongside the SQL, explanation, follow-up questions, and result preview. When the next question comes in, its embedding is compared against all cached embeddings using cosine similarity. A score above 0.92 is treated as a cache hit.
This means “Top 5 products by revenue” and “What are the five highest-revenue products?” resolve to the same cached result. The threshold of 0.92 is deliberately tight — it catches true paraphrases while rejecting genuinely different questions that happen to share vocabulary.
What gets cached:
- The generated SQL
- The plain-English explanation
- The three follow-up questions
- The result preview (first 5 rows)
- The similarity score of the cache hit
In practice, after the first day of use by a team, cache hit rates of 40% or more are typical. The analytics team asks similar questions repeatedly — “revenue this month”, “active customers by country”, “top products” — and the cache absorbs most of them. Each cache hit saves approximately $0.002 in API costs and shaves 2–3 seconds off the response time.
Section 7: Result Explanation and Follow-up Questions
Raw query results are useless to non-technical stakeholders. A table with columns product_id, product_name, and sum tells a product manager nothing. The explanation step closes this gap.
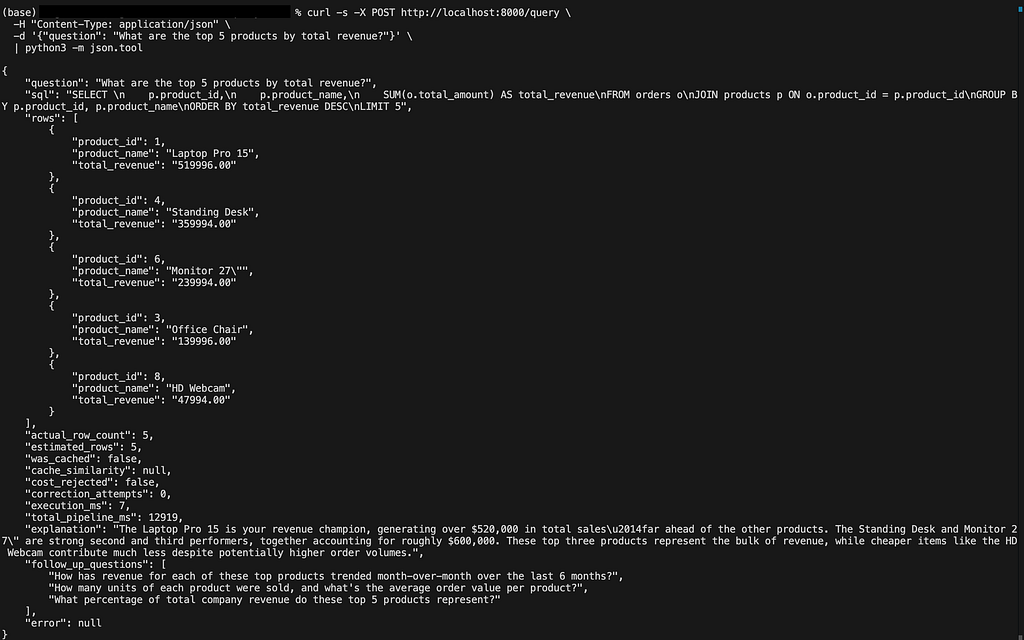
After execution, the first 10 rows of results are sent to Claude Haiku alongside the original question and the SQL that was run. The model returns a structured JSON response:
{
  "explanation": "Electronics products generated $187,432 in revenue this month,
    accounting for 73% of total revenue. The Laptop Pro 15 was the top performer
    with $52,000, followed by the Monitor 27\" at $31,800.",
  "follow_up_questions": [
    "How does this month's electronics revenue compare to last month?",
    "Which individual products had the highest revenue growth?",
    "What is the average order value for electronics versus furniture?"
  ]
}
The explanation uses specific numbers from the results. It is written for a non-technical reader. The three follow-up questions are clickable buttons in the Streamlit interface — clicking one pre-populates the question input and runs the pipeline immediately. This turns a one-shot query tool into a conversational analytics experience.
One important implementation detail: the explanation prompt sends at most 10 rows to the LLM. Sending unbounded results to an API is both expensive and potentially dangerous if results contain sensitive data. The application layer caps results at 500 rows; the explanation layer caps the LLM input at 10 rows. Both caps are enforced in code.
Section 8: Observability — A Gantt Timeline of Every Pipeline Stage
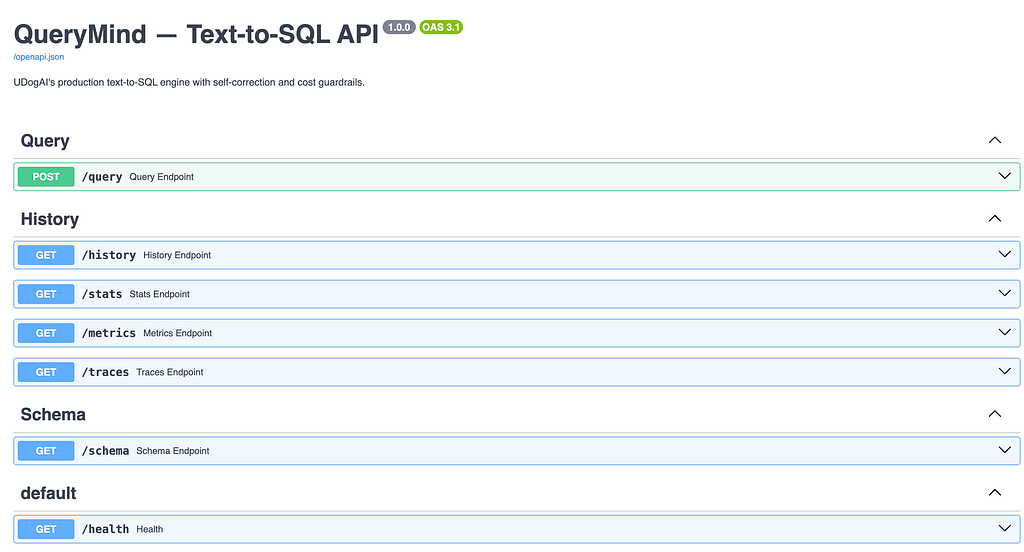
When a query takes four seconds, which stage consumed the time? Was it Claude’s API latency? The Qdrant vector search? The PostgreSQL EXPLAIN call? Without distributed tracing, you cannot answer that question. QueryMind instruments every pipeline stage with OpenTelemetry spans.
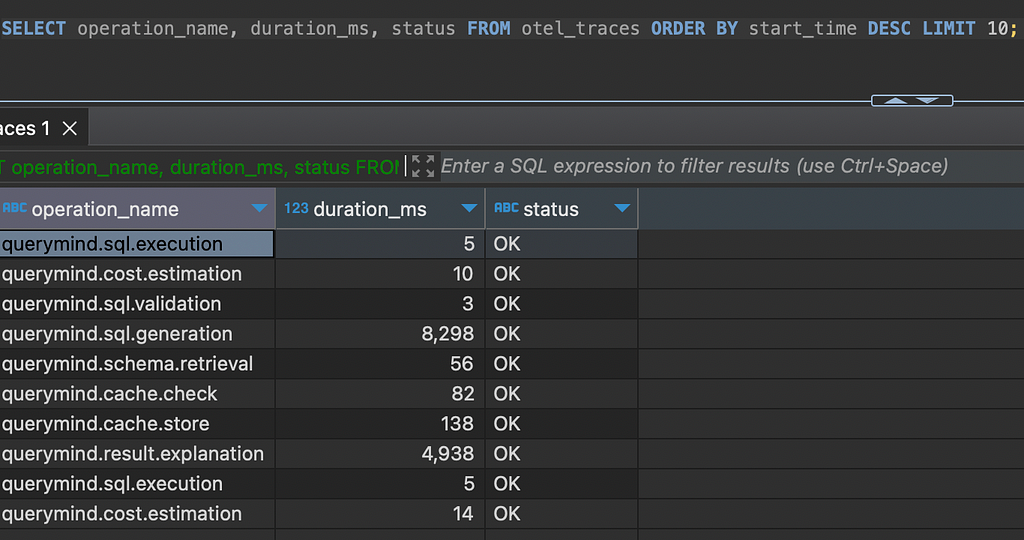
Rather than running an OpenTelemetry collector (which adds infrastructure complexity), QueryMind uses a custom PgSpanExporter that writes spans directly to a otel_traces table in the history database. Each row represents one pipeline stage:
span_id, trace_id, parent_span_id, operation_name,
start_time, end_time, duration_ms, status, attributes
The eight pipeline stages each become a named span:
- querymind.cache.check
- querymind.schema.retrieval
- querymind.sql.generation
- querymind.sql.validation
- querymind.cost.estimation
- querymind.sql.execution
- querymind.result.explanation
- querymind.cache.store
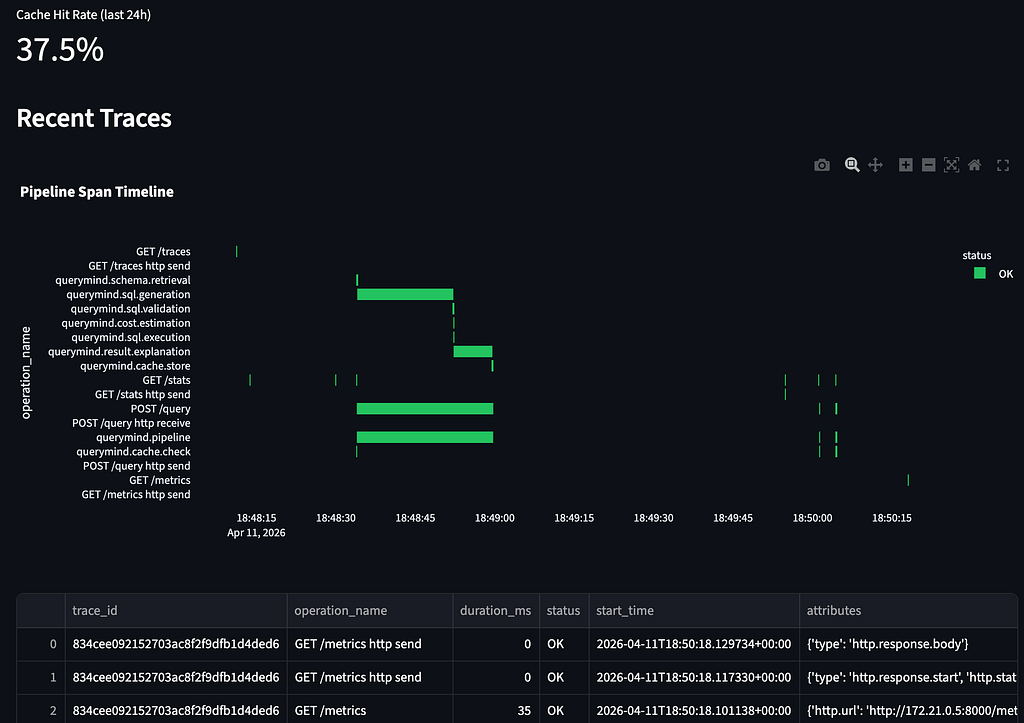
All eight are children of a root querymind.pipeline span that covers the full request. Span attributes carry context: question_hash, tables_retrieved, correction_attempts, estimated_rows, actual_rows.
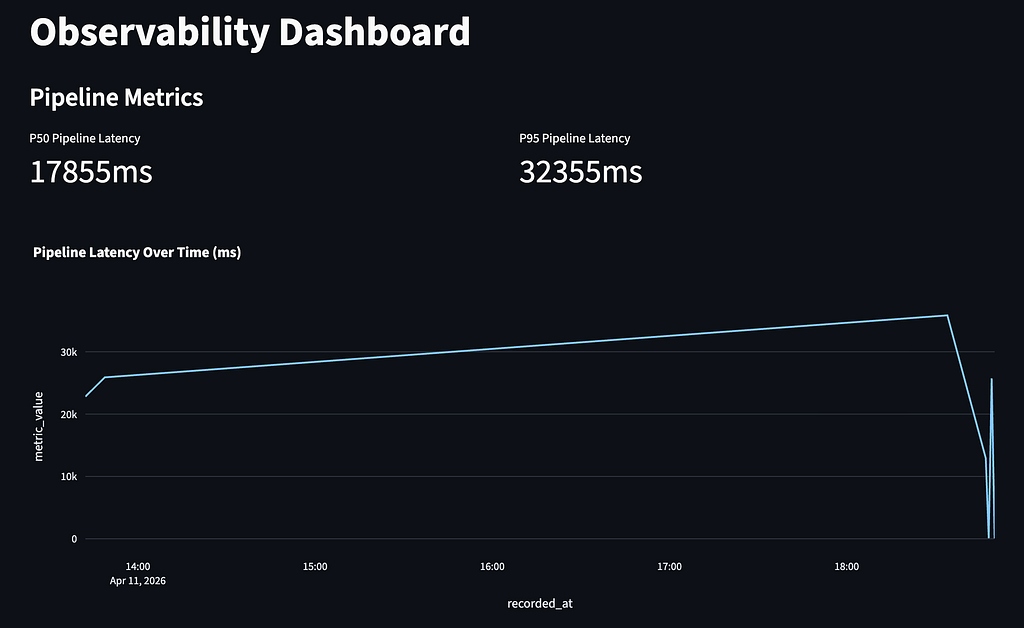
A separate metrics module accumulates counters and gauges in memory and flushes them to an otel_metrics table every 30 seconds via a background thread. Metrics include: query count (by outcome), pipeline duration, cache similarity scores, correction attempt counts, and SQL execution time.
The Streamlit Observability page renders these as a Plotly Gantt chart — each span as a coloured bar on a timeline, grouped by operation_name, coloured green for OK and red for ERROR. P50 and P95 latency metrics sit above the chart. This is the kind of operational visibility that makes a deployed system debuggable by someone who was not the original author.
Section 9: The GEval Benchmark — Putting a Number on SQL Quality
Every text-to-SQL system claims to be accurate. QueryMind has a number: SQL Correctness 0.87, Explanation Quality 0.91 on a 10-question golden dataset evaluated with DeepEval’s GEval metric.
The golden dataset spans three complexity tiers:
- Simple (3 questions): counts, sums, single-table filters. Example: “How many orders are in the database?”
- Medium (4 questions): joins, GROUP BY, HAVING clauses. Example: “What are the top 5 products by total revenue?”
- Complex (3 questions): date arithmetic, window functions, multi-join aggregations. Example: “What is the monthly revenue trend for the last 6 months?”
GEval uses Claude as the judge, scoring each output against a rubric: does the SQL query the right tables, apply correct filters, use appropriate aggregations, and include the necessary JOINs? The threshold for passing is 0.75 on both metrics. Simple queries scored above 0.95. Complex queries — the ones involving DATE_TRUNC, multi-table joins, and window functions — pulled the average down to 0.87, which is where self-correction earns its keep.
Running the full evaluation costs approximately $0.12 in Claude API calls. It takes about three minutes. It is repeatable. That is the point: quantitative evaluation is not optional for a system that non-engineers will rely on.
Section 10: What I Would Do Differently
Building QueryMind in twelve steps taught me a few things I would change in a second iteration.
Streaming the explanation. The explanation step is the slowest visible latency for the user — they have the SQL and the results table, but they are waiting for the explanation to appear. Streaming the Claude response token by token would make the UI feel dramatically faster even if the total wall-clock time is the same.
A feedback button. The most valuable training signal for a text-to-SQL system is a user marking a result as wrong. A thumbs-down button that logs the question, the generated SQL, and the user’s correction to the history database would create a dataset for future fine-tuning or few-shot prompt improvement. I left it out to keep the scope manageable, but it is the first thing I would add.
Domain-specific embedding fine-tuning. The all-MiniLM-L6-v2 model works well for general semantic similarity, but it has no concept of database terminology. "Orders placed last month" and "recent order activity" embed closer together than they should. Fine-tuning on pairs of equivalent analytics questions would push the cache hit rate higher and make schema retrieval more precise.
Result-level caching at the database layer. The semantic cache stores LLM outputs. But the underlying query result — the actual rows — could also be cached at the database level using PostgreSQL’s materialized views or a Redis layer. For dashboards where the same query runs every five minutes, this would eliminate DB load entirely.
If you’re looking for freelance or consultancy work on data pipelines, AI systems, or real-time platforms, reach out to me on X, or via email.
And, if this saved you time or sparked an idea, consider sponsoring me on GitHub. Thank you!
GitHub: https://github.com/dogukannulu
Email: dogukannulu@gmail.com