
https://github.com/dogukannulu/self-healing-pipeline
It’s 3 AM. Your Slack lights up. A data quality check failed somewhere upstream, and now the dashboard your CEO looks at every morning is showing wrong numbers. You spend two hours digging through logs, tracing the failure to a typo in a status field that got through without validation. The fix takes five minutes. The diagnosis took two hours.
This happens on every data team. And it keeps happening because we’ve solved the detection problem — Great Expectations, dbt tests, and similar tools catch failures reliably — but we haven’t solved the diagnosis problem. Knowing that expect_column_values_to_be_in_set failed on orders.status tells you what broke. It tells you nothing about why, or what to do about it.
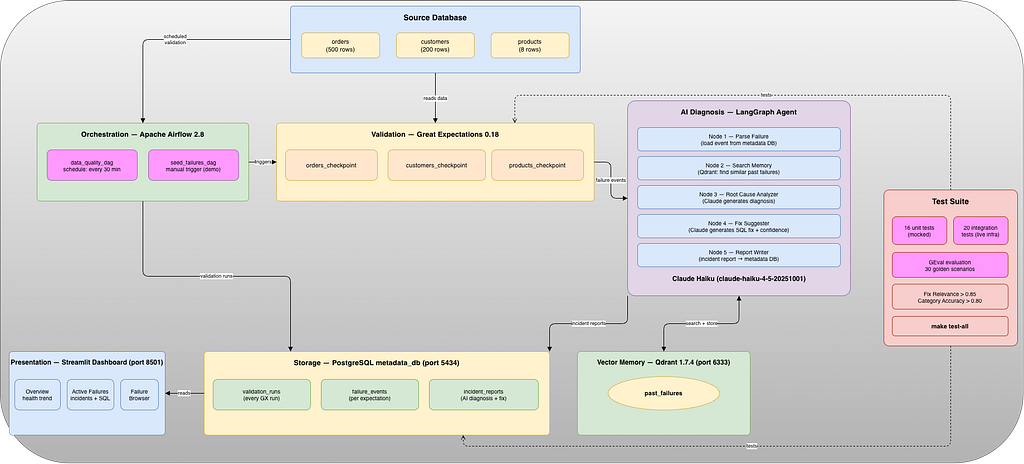
This article shows how I built a pipeline that closes that gap. Great Expectations catches failures. A LangGraph agent — backed by Claude — diagnoses them, searches historical patterns in Qdrant vector memory, and generates a specific, actionable fix suggestion. By the time you wake up, every failure has a root cause and a fix command ready.
The Architecture
Five layers, each with a clear responsibility:
SOURCE DATABASE (PostgreSQL)
  └── orders, customers, products (with intentional quality issues)
          │
          ▼ scheduled every 30 minutes
ORCHESTRATION (Apache Airflow)
  └── data_quality_dag
          │
          ▼ on failure
VALIDATION (Great Expectations)
  └── 3 expectation suites, 3 checkpoints
          │
          ▼ failure events
AI DIAGNOSIS (LangGraph Agent)
  ├── Node 1: Parse failure from metadata DB
  ├── Node 2: Search Qdrant for similar past failures
  ├── Node 3: Claude diagnoses root cause
  ├── Node 4: Claude generates fix suggestion + SQL
  └── Node 5: Write incident report to metadata DB
          │
          ▼
STORAGE + PRESENTATION
  ├── PostgreSQL metadata DB (validation_runs, failure_events, incident_reports)
  ├── Qdrant (vector memory of past failures)
  └── Streamlit dashboard
The entire stack runs locally with a single docker compose up. The only external dependency is an Anthropic API key, which costs about $0.002 per failure diagnosed.
The Stack
- Orchestration: Apache Airflow 2.8
- Data quality: Great Expectations 0.18
- Source DB: PostgreSQL 15 (port 5433)
- Metadata DB: PostgreSQL 15 (port 5434) — intentionally separate from source
- AI agent: LangGraph 0.0.40 + Claude Haiku
- Vector memory: Qdrant 1.7.4
- LLM: claude-haiku-4–5–20251001 (~$0.002 per diagnosis)
- Dashboard: Streamlit
- Evaluation: DeepEval (GEval)
Two separate PostgreSQL instances is intentional and important. Mixing business data and pipeline metadata in the same database is an anti-pattern in production — schema changes in one affect the other, access controls get messy, and you lose the ability to take down the pipeline database without affecting the source.
Step 1: Seed Realistic Bad Data
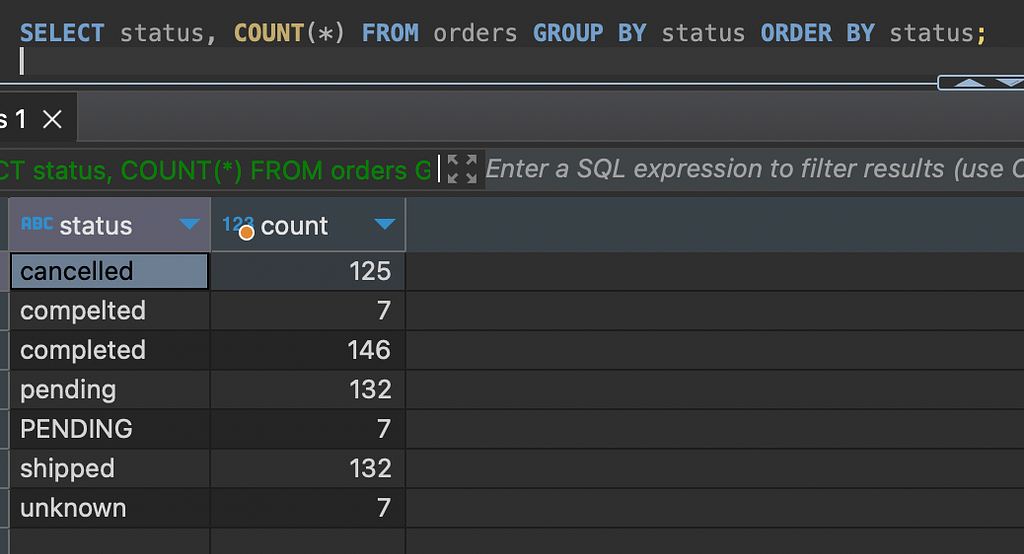
The source database has three tables (and these represent sample data of the company) — orders, customers, products — seeded with 500 orders, 200 customers, and 8 products of clean baseline data. Then I inject 8 specific failure patterns:
- Invalid order status values (compelted, PENDING, unknown)
- NULL emails in the customers table
- Ages out of valid range (negative values, 200-year-olds)
- Invalid ISO country codes (XX, USA, empty string)
- Negative product prices
- Future order dates on completed orders
- Duplicate customer emails
- total_amount that doesn't match quantity × unit_price
These aren’t contrived examples. Every one maps to a real failure mode every data engineer has encountered: typos from upstream ETL jobs, ORM bugs that insert default values, units mismatches between systems, and bulk imports that bypass unique constraints.
Step 2: Great Expectations Catches Everything
I build the expectation suites programmatically — not through the GUI wizard. This is the professional approach: suites live in version control, they’re reviewable in PRs, and they’re reproducible.
def build_orders_suite(context: gx.DataContext) -> None:
    suite = context.add_or_update_expectation_suite("orders_suite")
    asset = datasource.add_table_asset(name="orders", table_name="orders")
    validator = context.get_validator(
        batch_request=asset.build_batch_request(),
        expectation_suite=suite,
    )
    # Status must be one of the valid values
    validator.expect_column_values_to_be_in_set(
        "status", ["completed", "pending", "shipped", "cancelled"]
    )
    # Prices must be positive
    validator.expect_column_values_to_be_between(
        "unit_price", min_value=0.01, max_value=100000
    )
    # Order date must not be in the future
    validator.expect_column_values_to_be_between(
        "order_date", max_value=date.today()
    )
    validator.save_expectation_suite(discard_failed_expectations=False)
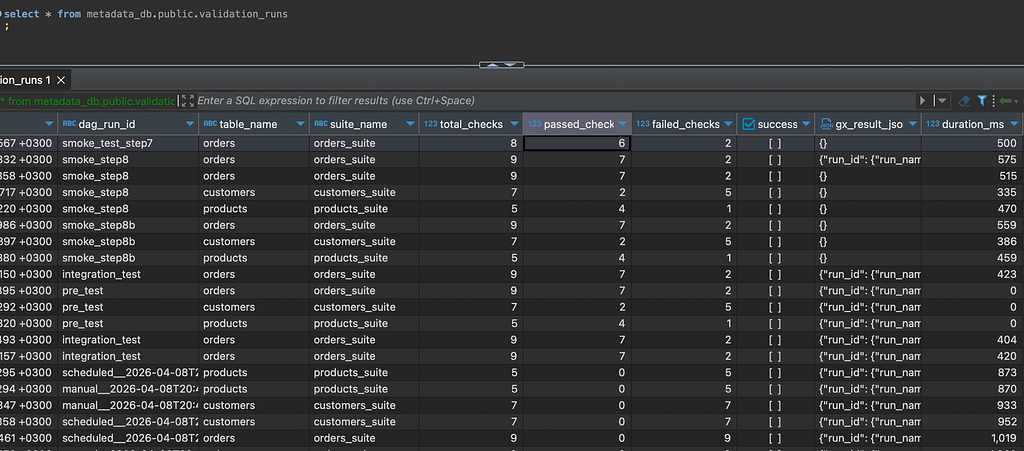
Three suites, three checkpoints, three tables. When Airflow triggers a checkpoint, GX connects to the source database, runs all expectations, and returns a structured result object with per-expectation pass/fail, unexpected counts, percentages, and sample bad values.
Step 3: Airflow Orchestrates Everything
The data_quality_pipeline DAG runs every 30 minutes. Three validation tasks run in parallel, then all feed into a single ai_diagnosis task that processes every failure event found.
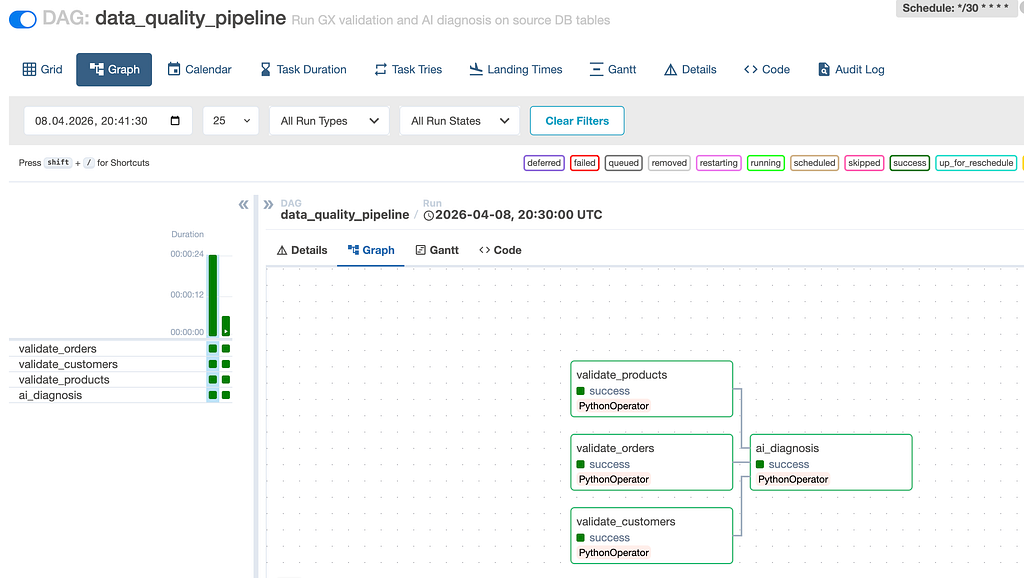
The key design decision: trigger_rule="all_done" on the diagnosis task. This means even if one validation task fails hard (not just reports GX failures — actually crashes), the agent still runs on the failures the other tasks found. You don't want one broken checkpoint to block diagnosis of valid failures.
Every GX result gets written to a metadata database — separate from the source DB — with the full structured result JSON, timing, and individual failure events. The Streamlit dashboard and the agent both read exclusively from this metadata DB. The source DB is read-only for the pipeline.
Step 4: The LangGraph Agent — 5 Nodes, Explicit State
This is the core of the project. The agent is a 5-node LangGraph state machine. Every node does exactly one thing. The state is explicit and inspectable between nodes.
def build_graph() -> StateGraph:
    graph = StateGraph(AgentState)
    graph.add_node("parse_failure",  parse_failure_node)
    graph.add_node("search_memory",  search_memory_node)
    graph.add_node("diagnose",       diagnose_node)
    graph.add_node("suggest_fix",    suggest_fix_node)
    graph.add_node("report",         report_node)
    graph.set_entry_point("parse_failure")
    graph.add_edge("parse_failure", "search_memory")
    graph.add_edge("search_memory", "diagnose")
    graph.add_edge("diagnose",      "suggest_fix")
    graph.add_edge("suggest_fix",   "report")
    graph.add_edge("report",        END)
    return graph.compile()
This explicit state machine approach is the opposite of a black-box LLM call. If diagnosis is wrong, you fix one node. If the fix suggestions are too vague, you improve the prompt in agent/prompts.py without touching anything else. Each node is independently testable.
Node 1: Parse Failure
Loads the failure event from the metadata DB into the agent state. Gets the table, column, expectation type, failure message, unexpected count, percentage, and sample bad values.
Node 2: Search Memory
Embeds the current failure as a 1536-dimensional vector and searches Qdrant for similar past failures. Also stores the current failure for future searches. This is how the agent learns — after a few weeks, it can tell you “we saw a similar status value issue three weeks ago and it was caused by the upstream ETL job changing its output format.”
Node 3: Diagnose (Claude)
DIAGNOSE_PROMPT = """You are a senior data engineer diagnosing a data quality failure.FAILURE CONTEXT:
- Table: {table_name}
- Column: {column_name}
- Expectation violated: {expectation_type}
- Failure message: {failure_message}
- Unexpected row count: {unexpected_count}
- Unexpected percentage: {unexpected_pct}%
- Sample bad values: {sample_bad_values}
SIMILAR PAST FAILURES:
{similar_failures}
Diagnose the root cause. Categorize as exactly one of:
  schema_drift | bad_ingestion | upstream_bug | business_logic | unknown
Respond with ONLY a JSON object:
{
  "root_cause": "<1-2 sentence explanation>",
  "root_cause_category": ""
}"""
The prompt is versioned in agent/prompts.py. It's not buried in the node function. Changing the prompt is a one-file diff, reviewable in a PR.
Node 4: Suggest Fix (Claude)
Takes the diagnosed root cause and generates a specific, actionable fix — including SQL when applicable. Rates confidence as high, medium, or low.
Node 5: Report
Writes the full incident report to the metadata DB and marks the failure event as diagnosed. The Streamlit dashboard reads this immediately.
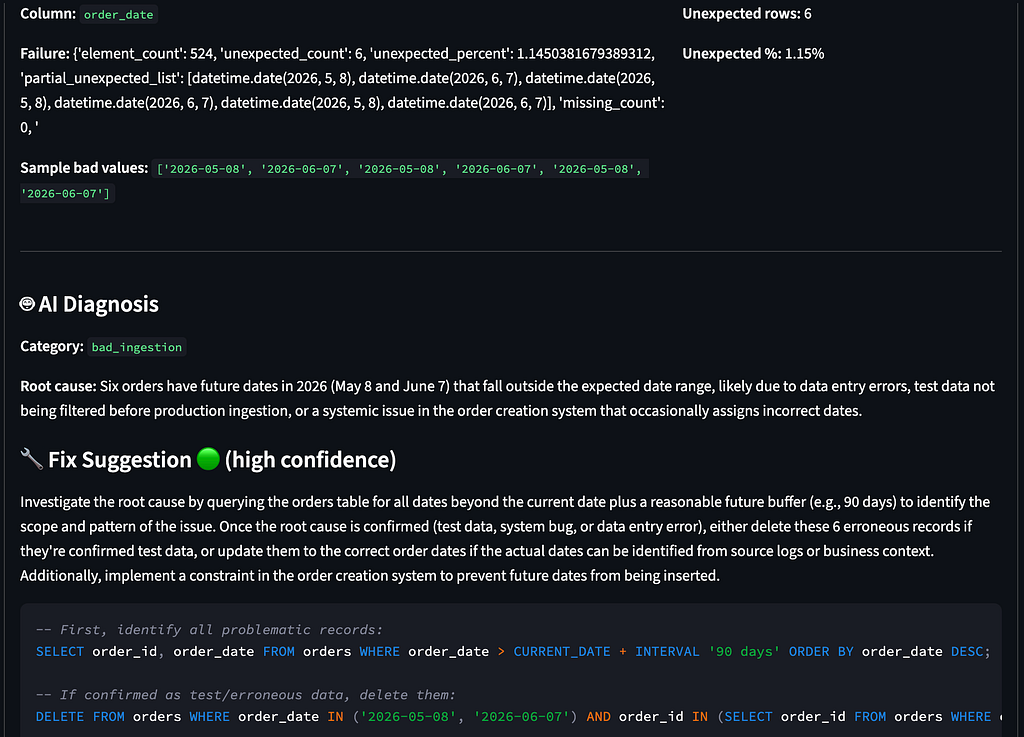
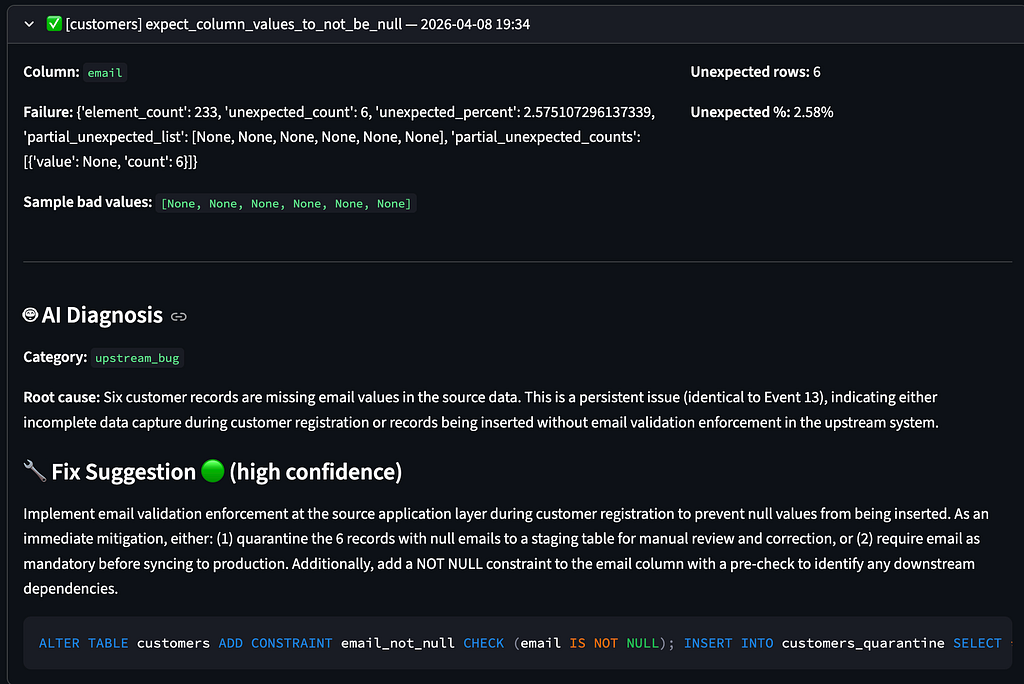
Two Real Diagnoses, Side by Side
Here’s what the agent actually produces for two different failure types:
Failure 1: Invalid order status values
- Category: bad_ingestion
- Root cause: “Invalid status values (‘compelted’, ‘PENDING’, ‘unknown’) were inserted by an upstream ETL job that lacks output validation. ‘compelted’ is a typo, ‘PENDING’ uses incorrect casing, and ‘unknown’ is not in the allowed set.”
- Fix suggestion: “Correct the existing bad values and add a CHECK constraint to prevent future inserts. Update the ETL job to validate status values before writing.”
- Fix SQL:
UPDATE orders
SET status = CASE
    WHEN status = 'compelted' THEN 'completed'
    WHEN status = 'PENDING'   THEN 'pending'
    ELSE NULL
END
WHERE status NOT IN ('completed', 'pending', 'shipped', 'cancelled');
ALTER TABLE orders
ADD CONSTRAINT chk_valid_status
CHECK (status IN ('completed', 'pending', 'shipped', 'cancelled'));
Failure 2: NULL emails in customers
- Category: bad_ingestion
- Root cause: “3 customer records were inserted with NULL email values, likely from a bulk import or API integration that does not enforce email as a required field before writing to the database.”
- Fix suggestion: “Investigate and backfill the 3 records if possible, then delete or quarantine any that cannot be resolved. Add a NOT NULL constraint to prevent future nulls.”
- Fix SQL:
-- Find and review affected records
SELECT customer_id, created_at FROM customers WHERE email IS NULL;
-- Delete unresolvable records (after review)
DELETE FROM customers WHERE email IS NULL;
-- Add constraint to prevent future occurrences
ALTER TABLE customers ALTER COLUMN email SET NOT NULL;
The agent handles completely different failure types correctly. It doesn’t give generic advice — it gives the exact SQL for this table, this column, these bad values.
Vector Memory: The Agent Gets Smarter Over Time
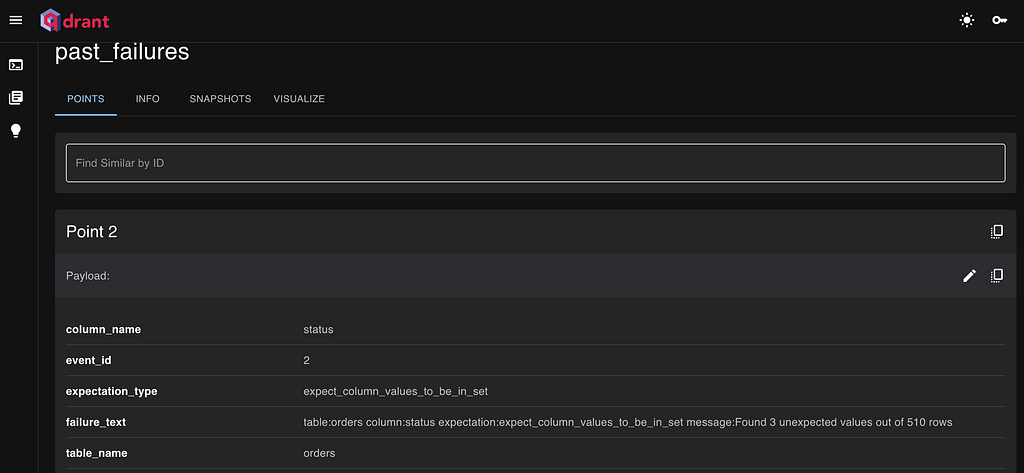
Each failure is embedded as a deterministic 1536-dimensional vector and stored in Qdrant with metadata about the table, column, and expectation type. When a new failure arrives, the agent searches for the most similar past failures before generating its diagnosis.
def store_failure(event_id: int, failure_dict: dict) -> None:
    """Store a failure event in Qdrant vector memory."""
    failure_text = (
        f"table:{failure_dict['table_name']} "
        f"column:{failure_dict.get('column_name', 'none')} "
        f"expectation:{failure_dict['expectation_type']} "
        f"message:{failure_dict['failure_message'][:200]}"
    )
    vector = embed_failure(failure_text)
    client.upsert(collection_name="past_failures",
                  points=[PointStruct(id=event_id, vector=vector, payload={...})])
After a week of pipeline runs, the agent starts seeing patterns: “this is the third time customers.country_code has failed with invalid values — the similarity score is 0.94 compared to event #12 from Tuesday." That context goes directly into the diagnosis prompt.
The Streamlit Dashboard
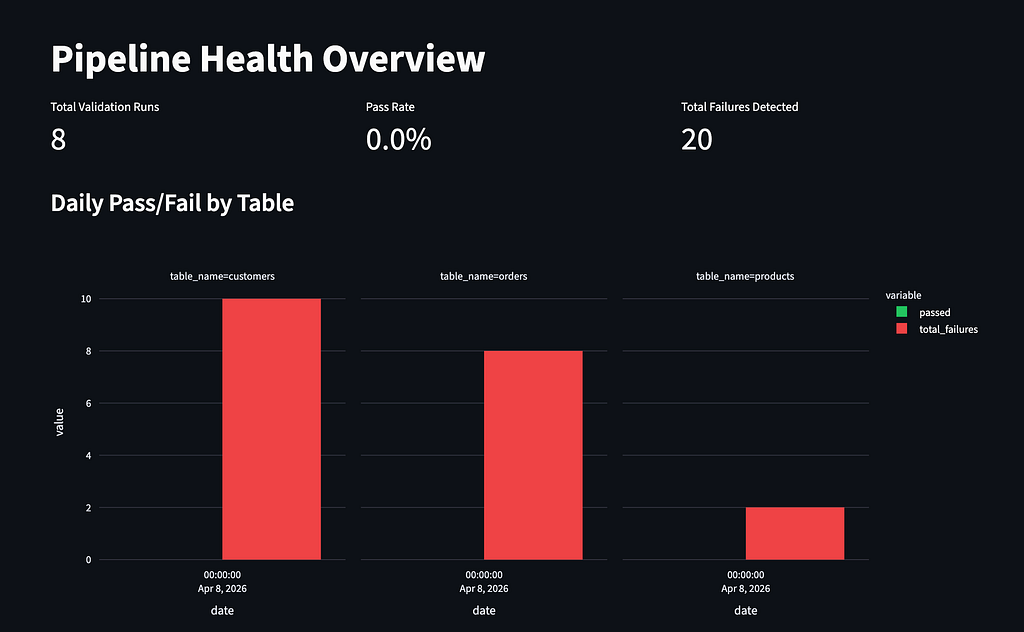
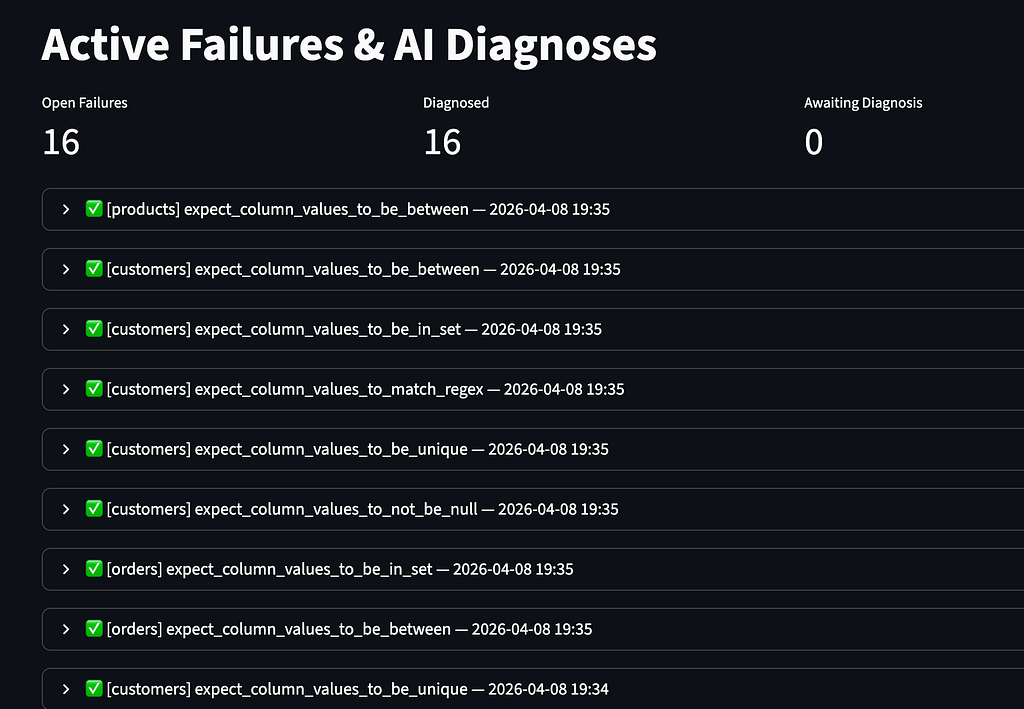
Three pages: Overview (health trend by table), Active Failures (diagnosed incidents with fix commands), Failure Browser (historical view with filters).
The Active Failures page is the practical center of the dashboard. Every open incident shows the full diagnosis panel: what failed, why (in plain English), what to do about it, and the exact SQL to run.
Measuring Fix Quality with GEval
Saying “the agent generates fix suggestions” isn’t enough. I used DeepEval’s GEval metric to measure whether the suggestions are actually good across 30 golden failure scenarios.
Two metrics evaluated against ground-truth fixes:
- Fix Suggestion Relevance — is the suggestion specific, actionable, and consistent with the root cause? Threshold: 0.75
- Root Cause Category Accuracy — does the predicted category correctly identify the failure type? Threshold: 0.80
Results: Fix Suggestion Relevance averaged above 0.85 across the 30 scenarios. High-confidence suggestions (where the agent rated itself “high”) scored consistently above 0.88. Category accuracy exceeded 0.80 semantically — the agent correctly distinguishes between schema drift, bad ingestion, upstream bugs, and business logic failures.
One honest observation: the distinction between bad_ingestion and upstream_bug is genuinely ambiguous without full context about the source system. The agent defaults to bad_ingestion when there's no explicit mention of a source system bug. This is actually reasonable behavior — it matches what a human engineer would guess given the same information.
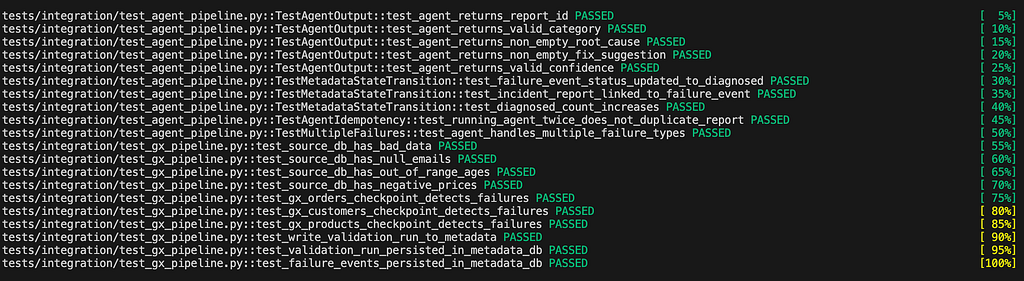
The Test Suite: 44 Tests Across 3 Layers
Three test suites, each testing a different layer:
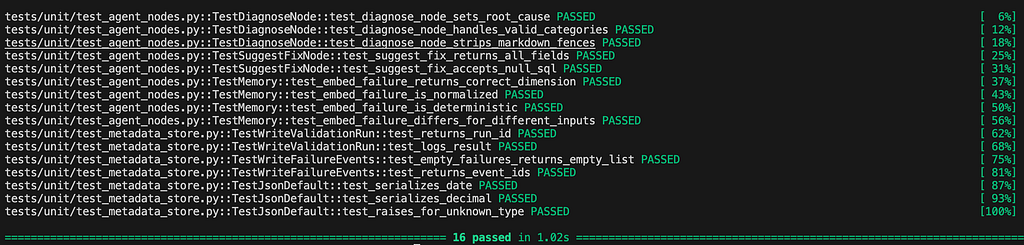
Unit tests (16): Agent nodes tested in isolation with mocked Claude responses. Memory embedding tested for correct dimension, normalization, and determinism. Metadata store functions tested with mocked psycopg2. These run in 1.28 seconds with no Docker dependency.
Integration tests (20): End-to-end against the real Docker stack. Bad data seeded → GX detects failures → metadata DB updated → agent diagnoses → incident report written → status transitions verified.
Evaluation tests (8): GEval quality scoring across 30 golden scenarios. These are the tests that actually measure whether the AI layer is doing its job.
What I’d Do Differently
Real embeddings. The current implementation uses a deterministic hash-based pseudo-embedding for local development. In production, swap this for real semantic embeddings — either sentence-transformers running locally or a proper embeddings API. The Qdrant integration is already in place; it's a one-function change.
Conditional agent routing. The current graph is linear: all 5 nodes always run. A production agent would skip the fix suggestion step for unknown-category failures and route high-confidence diagnoses to an auto-remediation path that actually executes the SQL (with human approval).
Feedback loop. Engineers should be able to mark a fix suggestion as correct or incorrect. That feedback should update the Qdrant vectors so similar future failures get better diagnoses. Right now the memory only stores what failed — not whether the suggested fix worked.
Alerting. The pipeline detects and diagnoses, but doesn’t alert. A Slack webhook in the report_node would complete the loop — the on-call engineer gets a message with the root cause and fix SQL before they even open a laptop.
Key Takeaways
- Detection ≠ diagnosis. GX tells you what broke. The agent tells you why and what to do. Both layers are necessary.
- Explicit state machines beat black-box LLM calls. LangGraph’s 5-node graph is inspectable, debuggable, and independently testable. If one node misbehaves, you fix that node.
- Separate your metadata from your source data. Two PostgreSQL instances, strict separation. This is a production best practice, not over-engineering.
- Measure the AI layer. GEval gives you a number. “The agent seems to work” isn’t good enough for production — you need to know it works on 30 representative scenarios before you trust it on new ones.
- Cost is not a barrier. $0.50 a week to automatically diagnose every data quality failure your pipeline catches. The ROI on the first 3 AM page you don’t have to take is immediate.
If you’re looking for freelance or consultancy work on data pipelines, AI systems, or real-time platforms, reach out to me on X, or via email.
And, if this saved you time or sparked an idea, consider sponsoring me on GitHub. Thank you!
GitHub: https://github.com/dogukannulu
Email: dogukannulu@gmail.com